

US 2020 Election Coverage:
Views from america’s affluent & HNWI’s
21 October 2020

320 validated Affluent & HNWIs interviewed two weeks before the POTUS election.
How did/will they vote? Will they brank rank? Will they rebalance their portfolios?
Fieldwork: Oct 16-20, 2020.
Survey Methodology
As the US Presidential election enters the critical final push, Altiant wanted to gauge the prevailing sentiment among affluent and HNWI individuals residing in the US. We asked 5 questions to 320 members of our LuxuryOpinions® panel, and the findings are presented below.
Before reading the results, we would like to very clearly stipulate a few thoughts surrounding the validity of this piece of research. Altiant is not a political polling company and this sample is not nationally representative. Similar to the geographic distribution of HNWIs in the U.S., our sample skews urban and towards the cities and states where the most HNWIs can be found (i.e. New York, California, etc.). This sample, in market research terms, is considered to be “convenience sampling” meaning we did not have structures in place to ensure representativeness on age, gender and region. Additionally a sample size of only 320 people produces a 5% margin of error.
Despite these caveats, we believe this data is interesting to synthesize as we are investigating a portion of the electorate that is often under represented in political polls, the highly affluent. In fact median household income of the sample was $411,000 and the median level of investable assets among the sample was $1.3M. For any questions about this research, please contact reports@altiant.com.
All charts below are based off n=320.
Q1. Are you likely to or have you already voted in the 2020 Presidential election?

· In the unweighted data set among early voters, we observed Biden had better than a 3 to 1 advantage (X% v. Y%)
· Among those likely to vote but had not yet voted at the time of the survey, the margin narrows greatly to just a 5% gap between the candidates (Biden X% v Trump Y%) when factoring in the other candidates and undecided voters. This is close to being statistically significant but it is not.
Q2. Regardless of whether or not you plan to vote, who do you support to win the 2020 Presidential election?

There were distinct differences between affluent men and women. When the data was weighted, we see that the preference among the affluent men interviewed, is statistically insignificant (within the margin of error) though the data for females is in fact statistically significant:

Q3. Which if any political party do you identify with?

In the unweighted data, we see 11% of Republicans saying they will vote for Biden, and 4% of Democrats saying they will vote for Trump.
We also observed a virtual dead heat of support between the two main candidates among other party voters.
Q4. Which party do you expect will win the 2020 Presidential election?

A majority of both men and women expect the Democratic party to win the presidential election.
Q5. Have you made or do you plan to make any changes to your investment portfolio based on your above expectation of the outcome of the election?

Nearly 6 out 10 affluent respondents have made or expect to make changes to their investment portfolio based on their expectation of the election results.
Of likely Trump voters who believe Biden will win or they are unsure of the outcome, 82% have made, or expect to make, portfolio changes to mitigate potential losses.
Of likely Biden voters who believe Trump will win or they are unsure of the outcome, 39% have made, or expect to make, portfolio changes to mitigate potential losses.
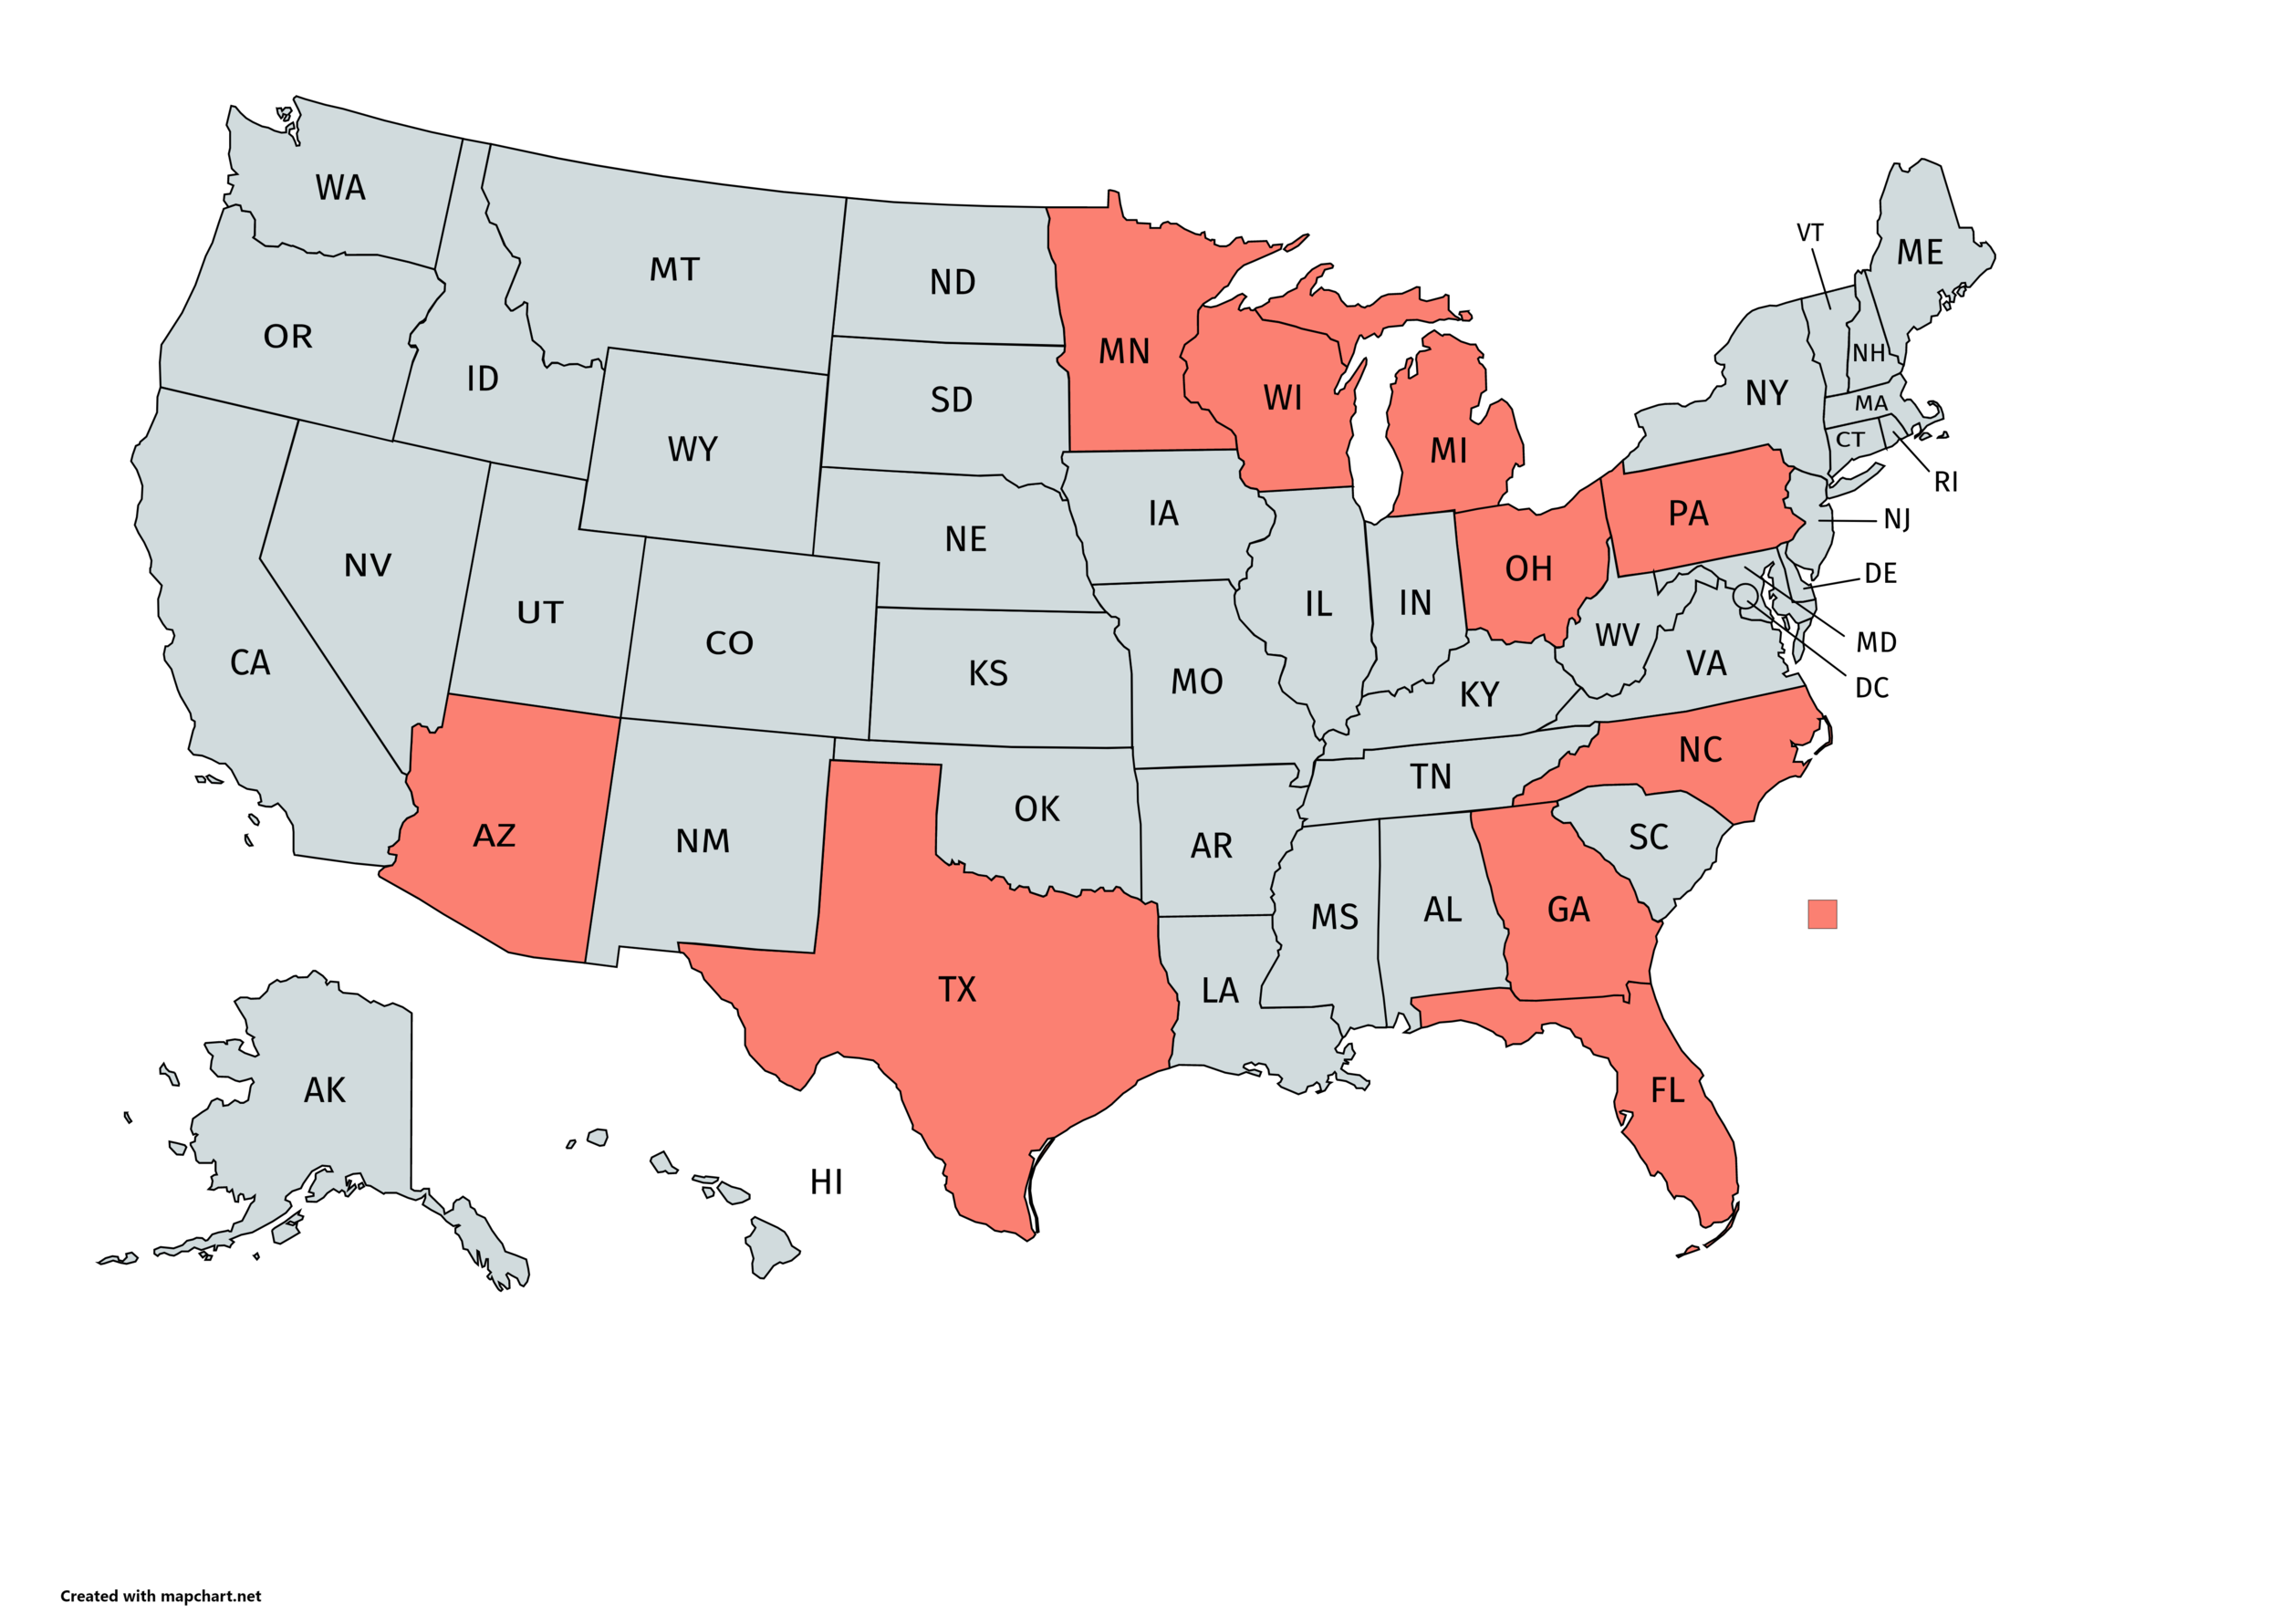
Key Geographies:
Respondents from some of the states that are considered to be “in play” this election (Florida, Pennsylvania, Ohio, Michigan, North Carolina, Georgia, Texas, Arizona, Minnesota and Wisconsin), Biden holds a lead of 8.5% (Biden 48.9% vs. Trump 40.4%)
Conclusions:
It was interesting to test the hypothesis that wealthier voters would be one of Trump’s most supportive groups. What we found was that our wealthy respondents, insofar as the Presidential election is concerned seem to mirror quite closely to what many of the robust nationally representative polls show.
The effect on wealth management companies here should be a positive one regardless of the outcome as people look to mitigate risk based on their expected outcomes.
To view the data set in full, or speak to us about any of your luxury/wealth research requirements, please email us at reports@altiant.com
Contributors
Lars Long, Founder & CEO
Todd Barth, Co-Founder & CFO
Ivan Murtov, Operations Director
Contact
reports@altiant.com
To join our report distribution list, please click the button to the right to subscribe.