
ALTIANT Global Luxury AND ASSET MANAGEMENT (GLAM) MONITOR


Q2 2026 RELEASE
I
Q2 2026 RELEASE I
Quarterly GLAM Monitor: Q2 2026
Release date: July 2026

Lars Long - Founder & CEO, Altiant
Welcome to the newest edition of Altiant’s Global Luxury and Asset Management (GLAM) Monitor. The monitor focuses on the behaviours and sentiments of our panel of validated global affluent/High Net Worth Individuals.
For GLAM, we have now conducted 15,000 interviews to construct a comprehensive and evolving view of luxury sentiment and behaviour. The eight years of study so far clearly show the significant change and disruption which the world has seen in that period. We hope that the future findings continue to assist your business strategies and decisions in the years ahead.
2025 was a year in a rush, with rapidly developing opportunities and threats for the luxury industry. While some brands found the going tough, others thrived. The first half of 2026 has, if anything, accelerated further, with the US/Israel war with Iran having an immediate global impact. Issues such as the energy and climate crises, other international conflicts such as the Ukraine war, ongoing tariff uncertainties and inflation continue to impact affluent sentiment. AI has also become firmly established, with many people now using it daily, either consciously or not.
All of the data is available within Tableau so that you can reformulate the results according to your own preferences. Age, gender, region and household income filters will enable you to interact with the data and cut it in different ways to identify key variances and trends.
We welcome the free and fair use of our data to meet your individual and business objectives, only asking that you clearly link your readers to the source of the data whenever applicable. As we publish additional iterations, trends will continue to strengthen, enabling you to further enhance your understanding of global luxury consumers. In the event you have any questions about the data, please contact us at glam@altiant.com
Altiant Founder and CEO, Lars Long
INTRODUCTION TO THE RESEARCH
All data presented in this GLAM monitor has been sourced from Altiant’s manually validated in-house panel of Affluent and High Net Worth Individuals (HNWIs), Luxury Opinions©. This iteration reports on Q2 2026 but will also include trended data from the trackers’ previous quarters. For any additional questions about this research, please contact glam@altiant.com.
METHODOLOGY
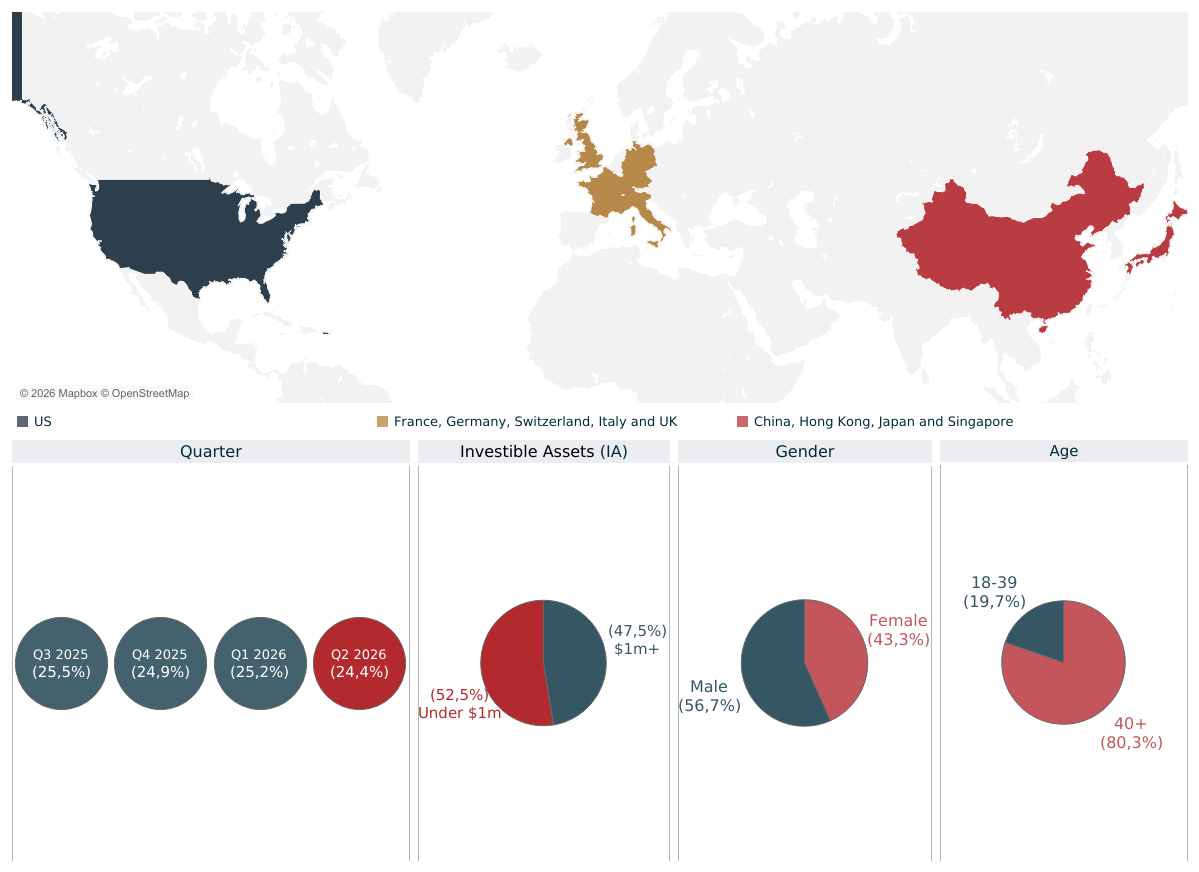
We continue to survey different members of our global panel whenever possible, trying to survey all respondents once a year at most. For this quarter, 468 affluent/HNWIs were surveyed between April and June 2026, with 165 in Europe, 162 in North America and 141 in Asia Pacific. Only 16% of this quarter’s sample was aged 18-39, with 84% aged 40+. The sample was split 58:42 M:F in terms of gender. Since starting the tracker in Q3 2018, we have now conducted a total of more than 15,000 interviews, 33% of which were among aged 18-39s (67% over-40) and with a gender split of 51:49.
MEDIAN HOUSEHOLD INCOME AND INVESTIBLE ASSETS
Normalised to $US, the median household income (HHI) in this quarter was $272k, while the median investible assets (IA) stood at just over $900k (exchange rates as per end of June 2026). This brought the median HHI across all 7+ years’ of study so far to $345k, while the median IA stands at $965,000.
In Q2 2026 we revised the question asking about the respondents’ sources of wealth, adapting it to account for any/all significant contributions to their wealth. The leading categories cited are:
· Personal investments: 77%, peaking in the US at 89%
· Savings through earnings: 76%, peaking in the US at 81%
· Profit from an investment property: 33%
· Inheritance: 27%, falling to just 18% in APAC
· Business sale(s): 14%
GLAM 5-YEAR
In July 2025, we released a GLAM Monitor Report, which collects five years of continuous and detailed data collection, marking a sustained contribution to thought leadership in luxury and asset management research. DISCOVER THE REPORT AND MAIN INSIGHT
STUDIED POPULATIOn
KEY QUARTERLY CHANGES
Travel spending has remained robust, with median annual spend nudging upwards to $12,250.
Wellness spending was introduced as a new category measure in this quarter, with 25% of current wellness customers planning to boost their spend in 2026/27 and only 15% cutting back.
Following the outbreak of the US/Israel war with Iran, 69% are now concerned about the geopolitical stability in the world, up from 62% in Q1.
Among the aforementioned 69%, 31% plan to spend less while 47% think they will save more as a result of this geopolitical concern. In terms of travel, 42% think they will consequently take fewer international trips and 38%plan to take more domestic ones.
More than two thirds (68%) are now using AI programs (up from 60% in Q1), rising to almost three quarters of millennials, American and APAC respondents.
Almost half (47%) now say that they own at least one electric or hybrid car (rising to 65% among the affluent/HNW Chinese response), a new tracker high point.
LUXURY PURCHASES
LUXURY BEHAVIOUR
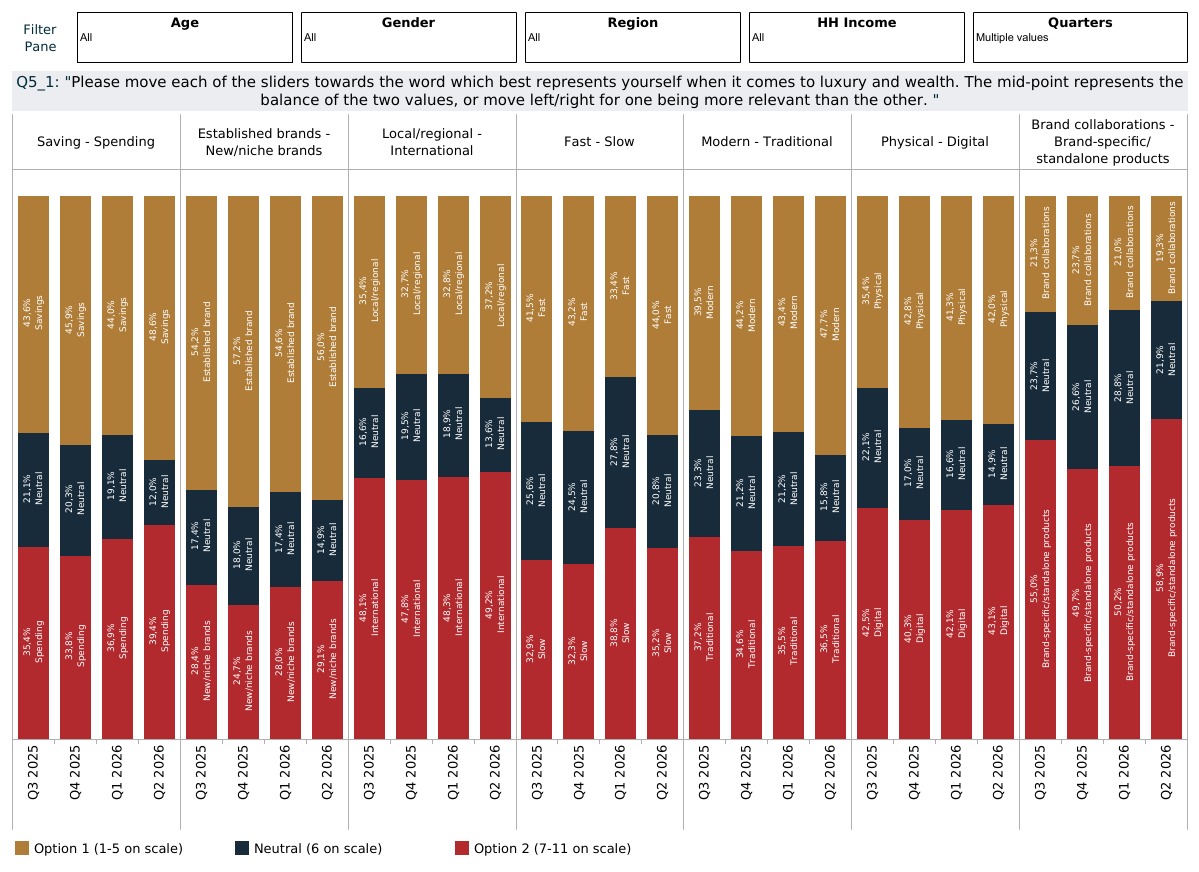
“Which of the following words best represents yourself when it comes to luxury and wealth?”
Base: 2,830 global affluent/HNWIs | Source: LuxuryOpinions®/AltiantThis question was introduced for 2025, with respondents using an 11-point slider to indicate which words from the following pairs best sums them up (6 being the mid-point). The numbers below represent a net of the five points closest towards each word (bottom 5/top 5), with the balance remaining in the mid-point. While most pairs are reasonably even between the two extremes, there is a clear preference for established brands (56%) and brand-specific/standalone products (59%) rather than niche brands and collaborations.
Saving vs Spending: 49% vs 39%
Established brands vs Niche brands: 56% vs 29%
Local/regional brands vs International brands: 37% vs 49%
Fast vs Slow: 44% vs 35%
Modern vs Traditional: 48% vs 37%
Physical vs Digital: 42% vs 43%
Brand collaborations vs Standalone products: 19% vs 59%
PAST LUXURY PURCHASES (Past 12 Months)
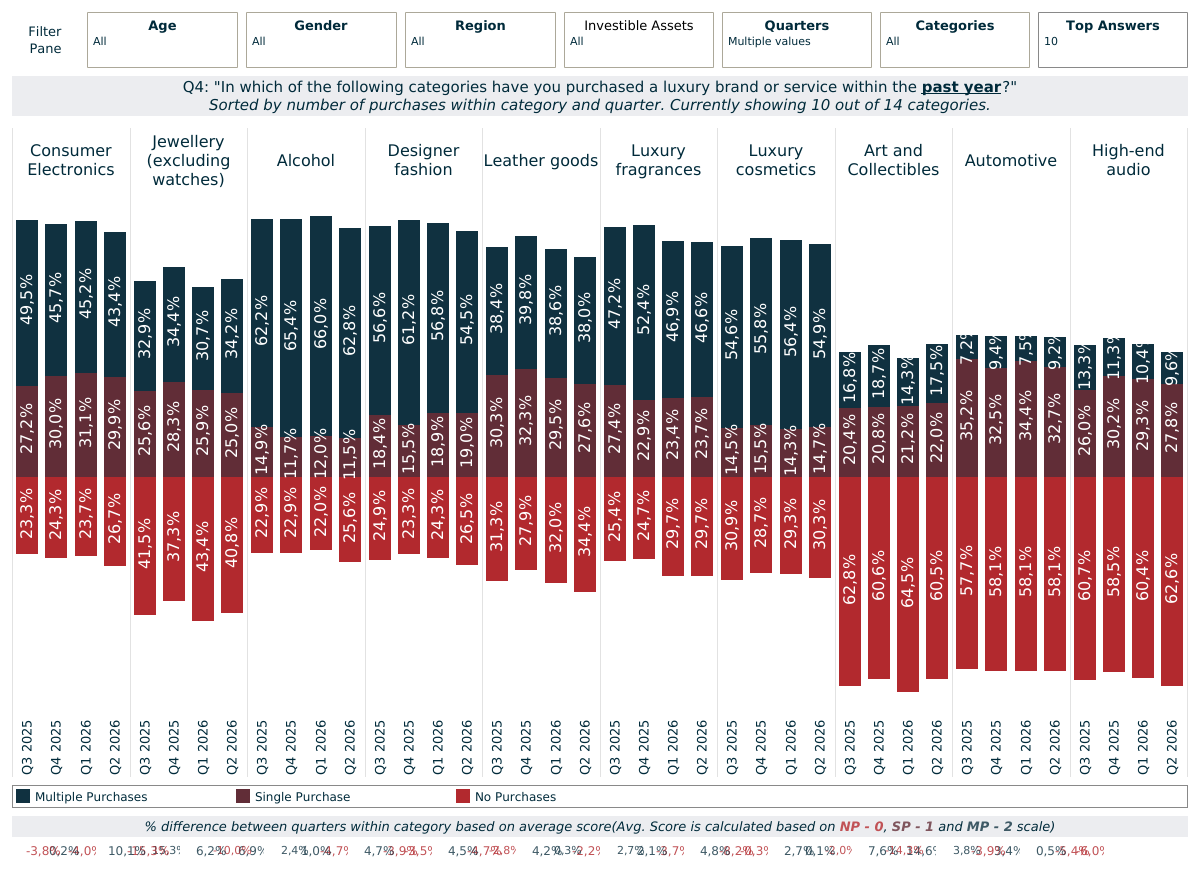
“In which of the following categories have you purchased a luxury brand or service within the past year?”
Base: 15,012 global affluent/HNWIs | Source: LuxuryOpinions®/AltiantThe travel industry remains in rude health overall, with experiences coming to the fore. The war in Iran has undoubtedly had an impact on travel destinations, as seen in the Focus on Travel section. The share of wealthy individuals who said that they had taken a luxury holiday reached a new tracker-peak of 90% in Q4 2024 and has stayed around this point since (88% in Q2 2026), with 68% taking multiple trips within the past year. Tourism remains firmly at the top of the list for share of category purchases and a little way ahead of the nearest cluster of other categories.
Various others such as wealth management services, designer fashion, alcohol, electronics and cosmetics/fragrances have also remained popular and purchased by 70-80% within the past year. Purchases of leather goods and cosmetics/fragrances see a clear skew towards women, while men are more likely to buy watches and use wealth management services. Luxury automotive (42%), art and collectibles (39%) and high-end audio (37%) remain the least likely categories to have been purchased within the past year.
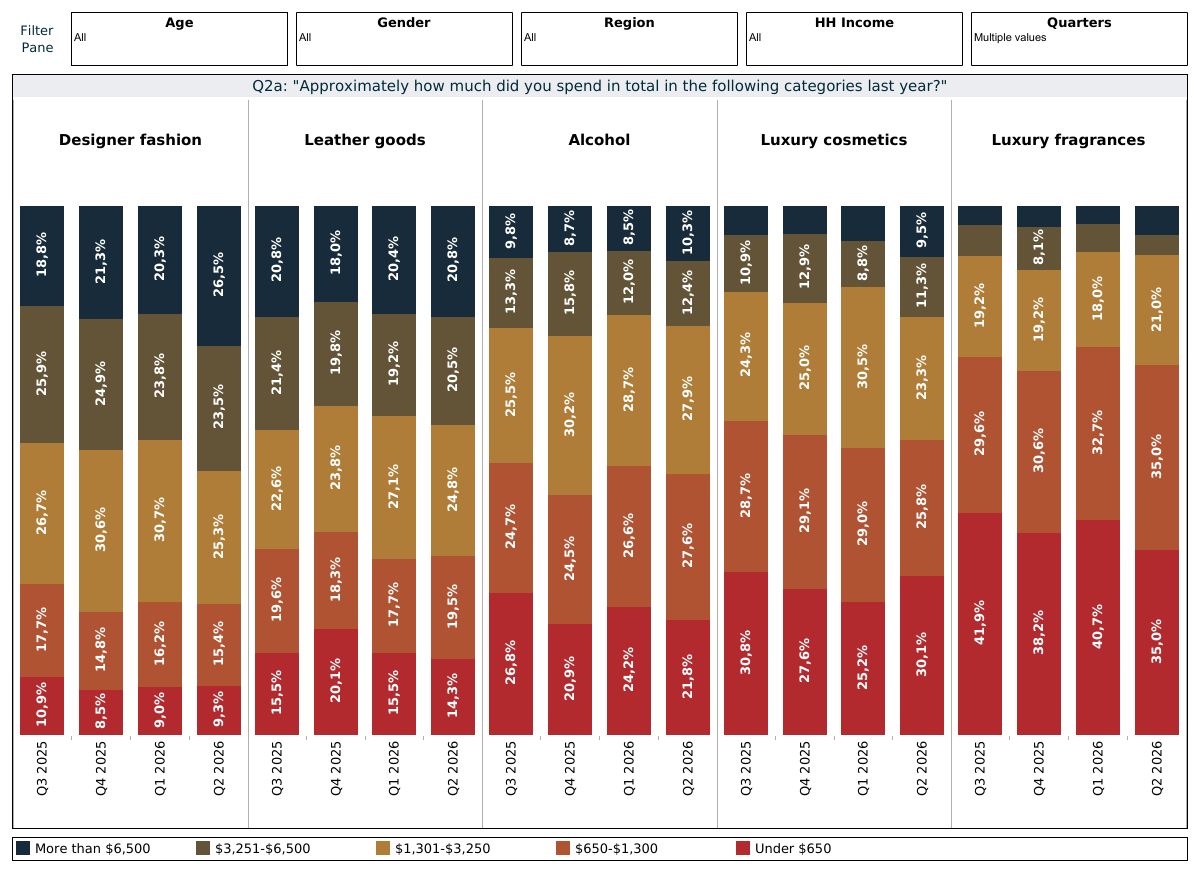
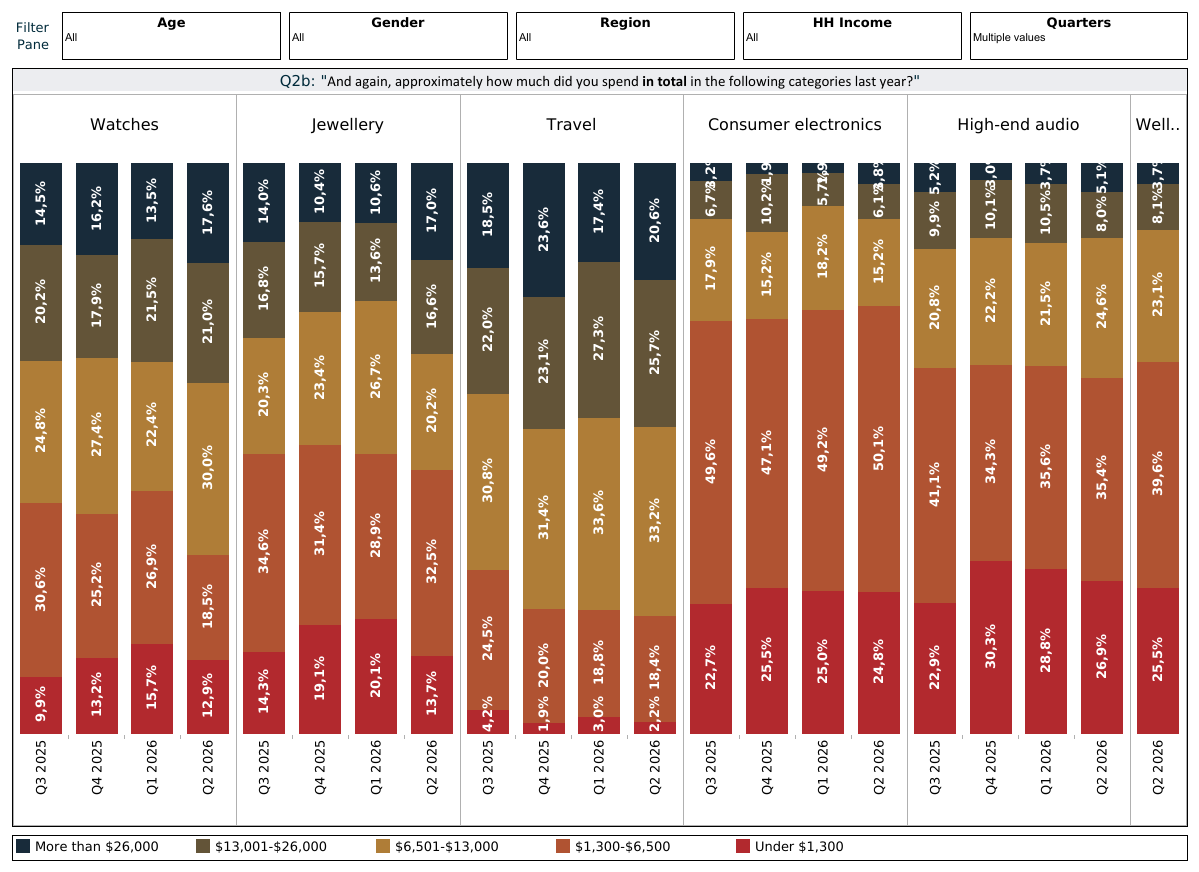
“Approximately how much did you spend in total in the following categories last year?”
Base: global affluent/HNWIs who made purchase(s) in the relevant categories | Source: LuxuryOpinions®/AltiantAmong the typically lower-priced categories, fragrances had a median normalised spend of just over $925, a short way behind cosmetics ($1,200), leather goods ($2,500) and designer fashion ($3,250). Travel had the highest median annual spend and is the only category to exceed $10,000: spending stood at $12,250, broadly in line with the previous quarter.
Watches followed a short way behind ($10,500), with jewellery at $7,750, high-end audio at $4,750 and electronicsjust short of the $4,000 mark. Wellness (e.g. spas/retreats, treatments, coaching, longevity) was introduced as its own category from this quarter and is evidently something which many affluent/HNWIs attach a lot of importance to: median spend was just over $4,500.
Luxury Purchase Intent (Next 12 Months)
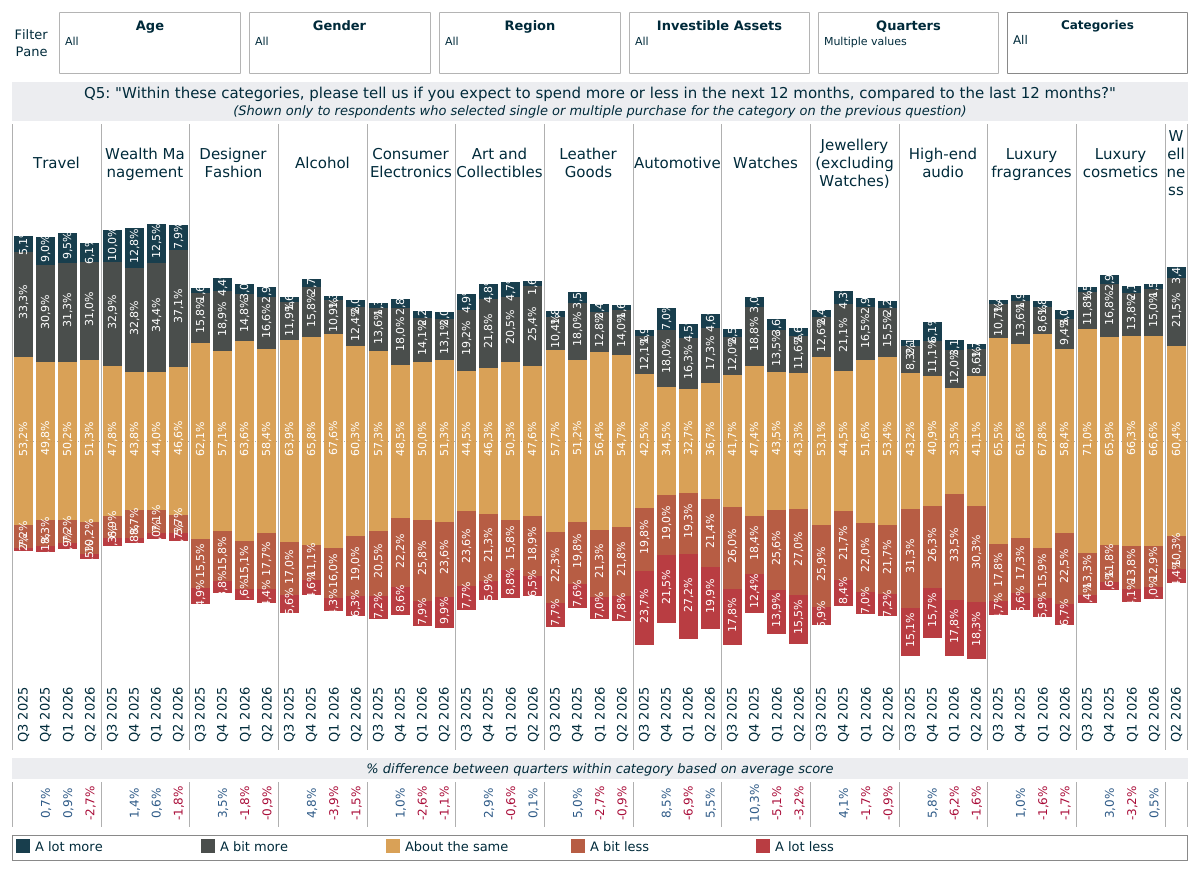
“Do you expect to spend more or less in the next 12 months, compared to the last 12 months?” - Active buyers, past 12m
Base: 15,012 global affluent/HNWIs | Source: LuxuryOpinions®/AltiantPurchasing trends remained somewhat consistent across 2024 but saw a clear and significant shift in 2025 with a cautious mentality prevailing. Many brands have reported difficult sales periods recently, with purchasing intentions in several categories suggesting further challenges for 2026.
Projected spending remained broadly flat vs Q1, although several categories continue to see a relatively high share of potential cutting back. High-end audio (49%), watches (43%) and automotive (41%) have the highest share of current category users planning to reduce their spend in the year ahead. Various other categories such as jewellery (29%), leather goods (30%) and art and collectibles (25%) also saw around a quarter of their current buyers planning to spend less over the next year.
Overall, travel and wealth management are the best performers, with only around 10% expecting to cut back. Indeed, 37% and 45% respectively expect to increase their spending in these categories in the year ahead. Many affluent/HNWIs appear to want to plan financially for unforeseen events like international conflict, political change or to hedge against inflation. Wellness was introduced as a new category measure in this quarter, with 25% of current wellness customers planning to increase their spend in 2026/27, 15% cutting back and the remaining 60% spending about the same.
“You mentioned that you have not purchased luxury items from the following categories within the last year/Do you think you will make purchases in any of these categories within the next year?”
Among non-category buyers, relatively few expect to start purchasing within the next year. Travel is the category which may be able to attract renewed travellers, with 29% expecting to take at least one trip again in the next 12 months. Automotive also has just over one quarter (29%) of potential new customers in the year ahead. All of the other categories only have around one in five current non-buyers who expect to start doing so in 2026/27.
PURCHASE CHANNELS
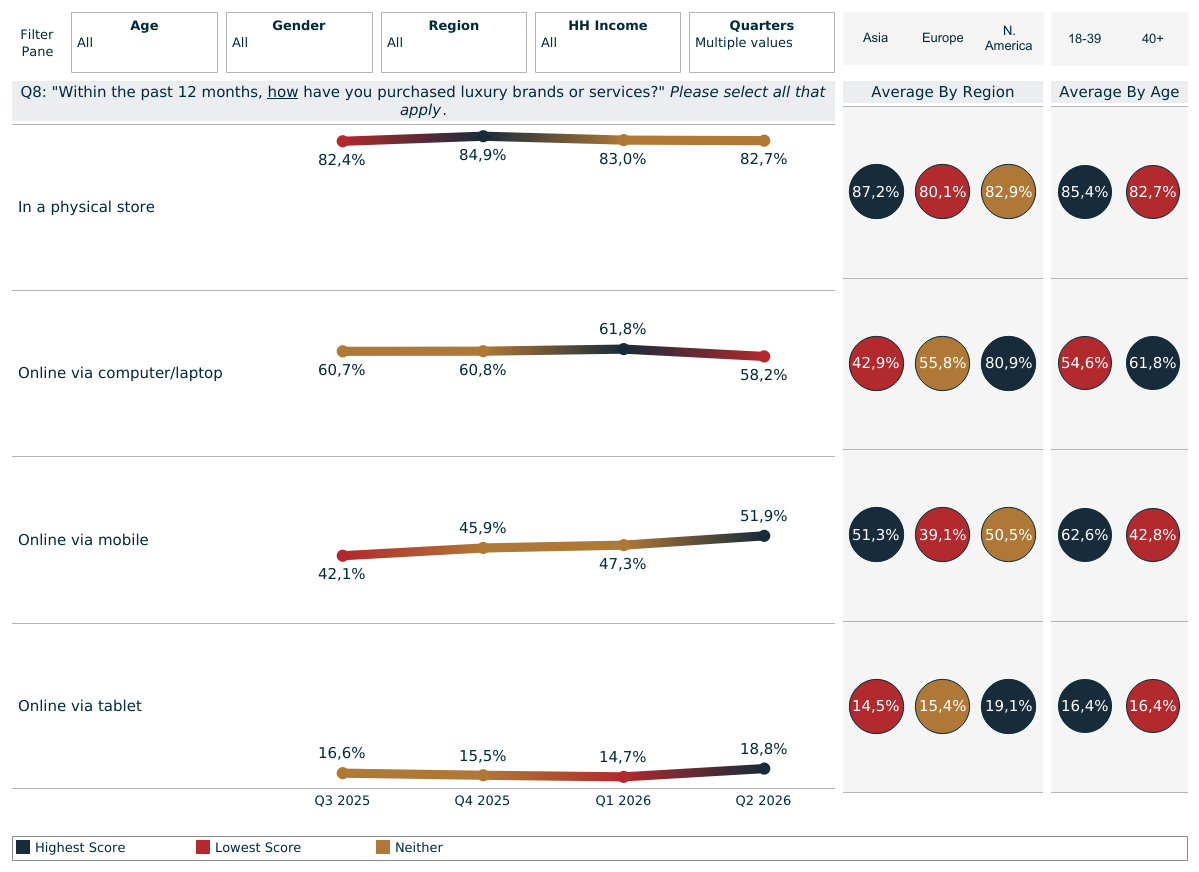
“Within the past 12 months, how have you purchased luxury brands or services?”
Base: 15,012 global affluent/HNWIs | Source: LuxuryOpinions®/AltiantPrior to Covid-19, the share of consumers buying luxury goods/services in a physical store hovered around the 85% mark. This fell as low as 67% in Q2 2021 and while there were some fluctuations across 2022 and early 2023, it stabilised around the 80% mark across 2024/25, remaining flat at 83% in this quarter.
The past two years have also seen a notable uplift in online luxury shopping, although this too saw some fluctuation over the past year. As of Q2 2026, 58% said that they had purchased luxury goods or services via their computer/laptop, a 4-percentage point fall vs Q1, rising to 80% of Americans but at half that level in APAC. Purchases via mobiles continue to fluctuate and nudged up by 4-percentage points to 51% in Q2 while those via tablets also did so to 19%. Men and over-40s comfortably remain the least likely to have shopped via electronic devices.
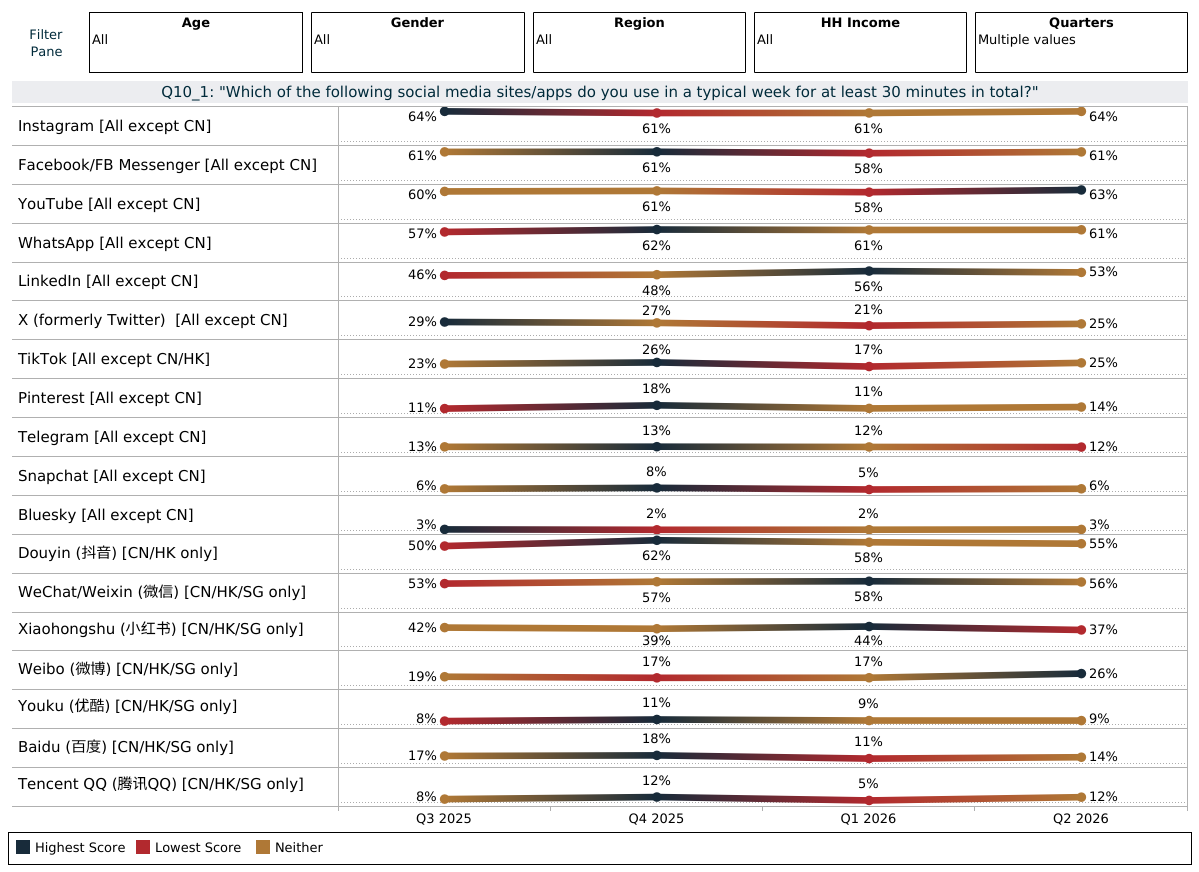
SOCIAL MEDIA INTERACTIONS
“Which of the following social media sites/apps do you use in a typical week for at least 30 minutes in total?
Base: 2,830 global affluent/HNWIs | Source: LuxuryOpinions®/AltiantThis question was introduced from Q1 2025 to provide a greater level of detail about social media usage. The unique nature of Chinese social media means that its specific sites were only shown to respondents in China, with all other markets seeing the same options. Respondents from Hong Kong were shown both the Western/international sites as well as the Chinese ones. Within China, Douyin is highly popular and used by 75% of the Q2 sample. Nearly all Chinese respondents said that they used Weixin (98%), while two thirds (63%) use Xiaohongshu and 47% use Weibo.
Among the non-Chinese markets, Instagram (64%), YouTube (63%) and Facebook (61%) were the most popular, followed by the professional networking site LinkedIn (53%). The direct messaging app, WhatsApp, also remains popular with 61% using it for at least 30 minutes in a typical week. Women are much more likely to use the former two sites, with men more likely to use YouTube, WhatsApp and LinkedIn. Perhaps as a result of recent controversies, usage of X/Twitter has been ebbing away in our tracker, standing at only 25% in Q2. Finally, TikTok weekly usage stands at 25% of this affluent cohort, while 14% use Pinterest. Back to Top
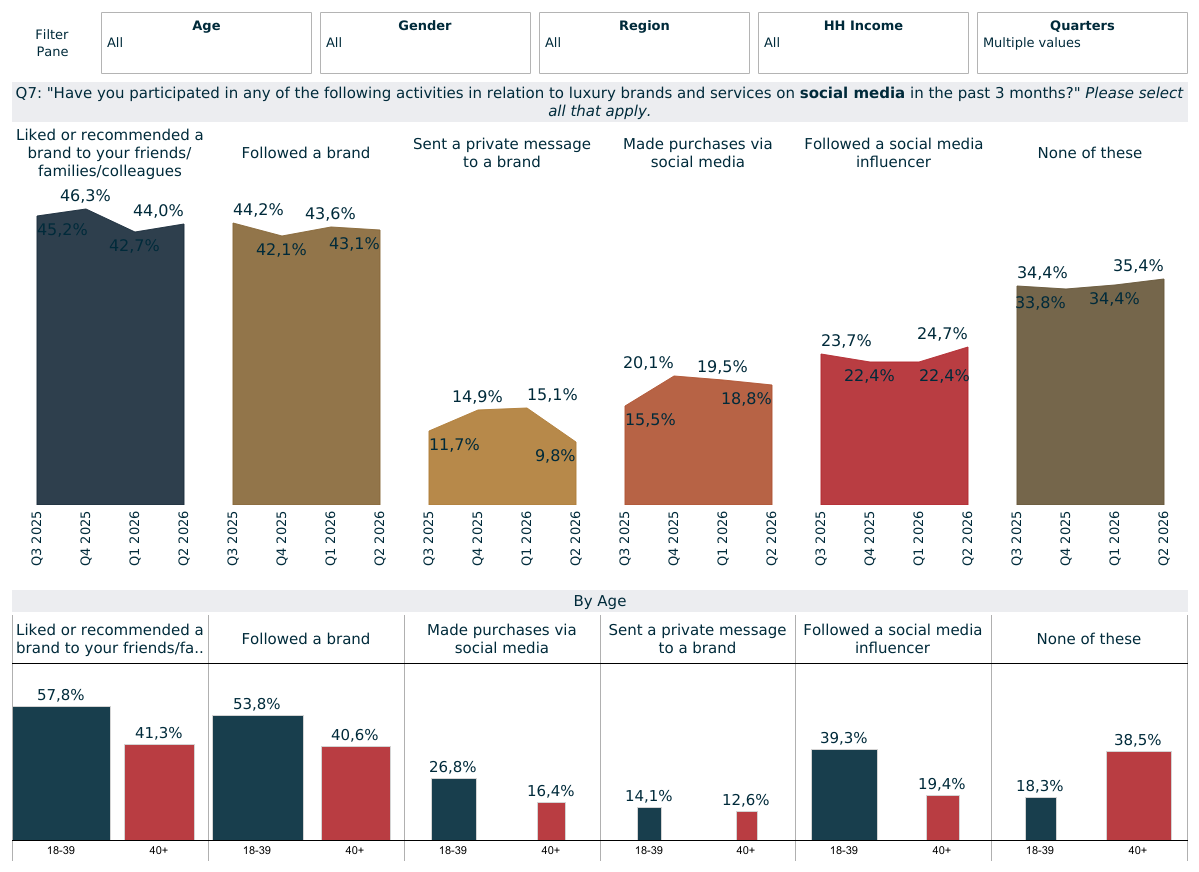
“Have you participated in any of the following activities in relation to luxury brands and services on social media in the past 3 months?”
Base: 15,012 global affluent/HNWIs | Source: LuxuryOpinions®/AltiantIn line with online retail prospering, social media is now key for most luxury brands. Some 43% of the Q2 sample said that they had followed a brand, while 44% had liked or recommended one to family, friends or colleagues within the past three months, both figures broadly in line with the previous quarters. In both cases, women and under-40s continue to be the most likely to do so. Elsewhere, under one in five made purchases via social media (19%) or sent a private message to a brand (10%), with under-40s again most likely to do so.
Many brands are dedicating parts of their marketing budgets to social media influencers. With one quarter (25%) of wealthy individuals saying that they had followed influencers within the past three months, this can be a lucrative option if well-chosen partners are utilised. Over-40s, men and Europeans are the least likely groups to do so at just one in five. Finally, 35% reported that they made none of these social media interactions within the past three months.
LUXURY & SUSTAINABILITY
Attitudinal Statements
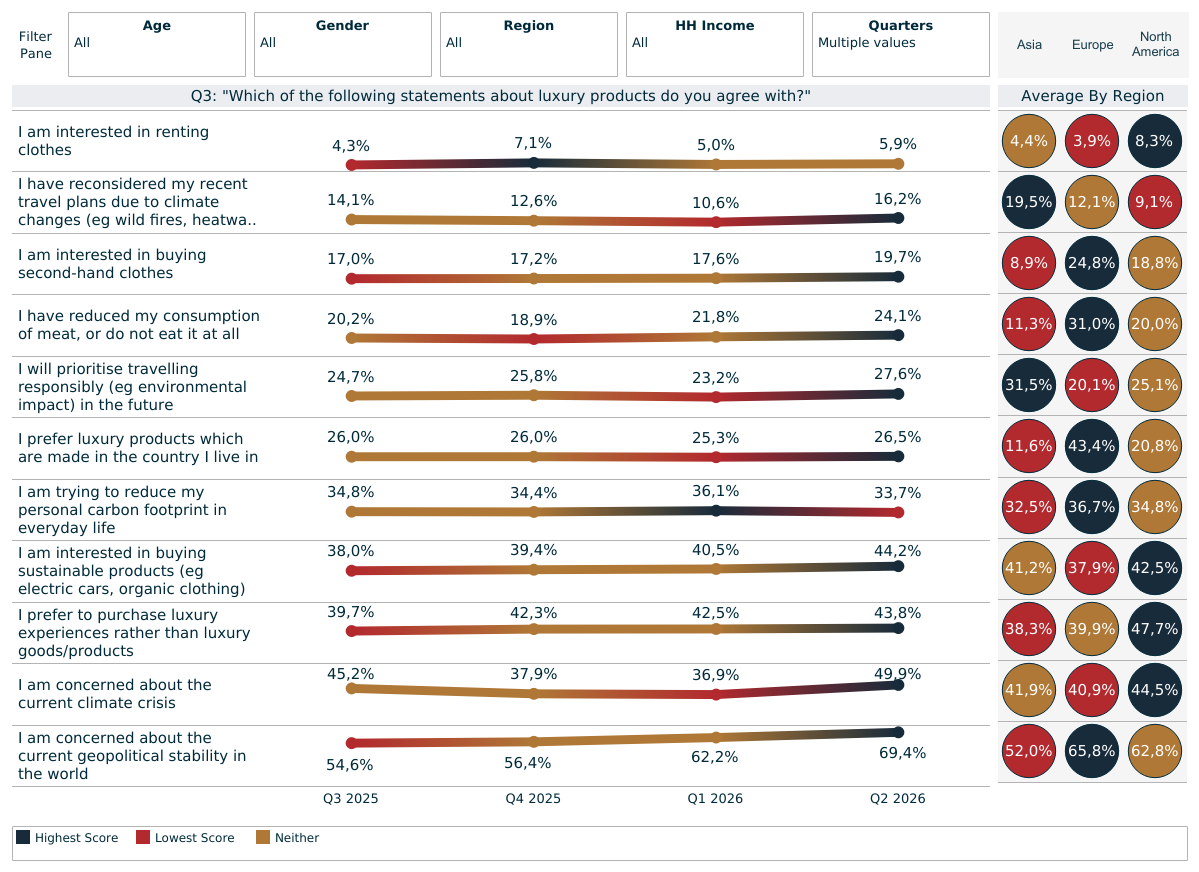
“Which of the following statements about luxury do you agree with?”
Base: 15,012 global affluent/HNWIs | Source: LuxuryOpinions®/AltiantRecent years have led to many affluent/HNWIs reassessing their purchases of luxury goods, often instead preferring to spend their money on luxury experiences: two in five (44%) say that they now prefer luxury experiences over goods/products. As seen in Section 1, tourism is buoyant and sustainable/ethical trips will remain prevalent: 28% plan to prioritise responsible travel in the future. Meanwhile, 16% say that they have reconsidered their recent travel plans due to climate changes such as heatwaves and wildfires.
Similarly, many people are opting to rent items rather than buy them, particularly in categories such as fashion and jewellery. Sustainability and tapping into the circular economy are at the heart of this growth, although that still only 6%are interested in renting clothes indicates that this is likely to be gradual. Meanwhile, 20% are interested in buying second-hand clothes, though this figure continues to lag in Asia where only 10% are receptive.
Wealthy individuals are also gravitating towards brands which have a genuine sustainable ethos and positioning. Two in five (44%) are interested in buying sustainable products such as electric cars or organic clothing, while half are concerned about the climate crisis. A slightly lower share are also now trying to reduce their personal carbon footprint in everyday life (34%) and/or reduced/ eliminated their consumption of meat (24%).
Notably, 69% are now concerned about the geopolitical stability in the world (rising to 76% in Europe), up from 56% in Q4 and 62% in Q1. At the time of writing, a tentative ending to the war in Iran has been announced but complications remain regarding the ceasefire and the passage of ships through the Strait of Hormuz. The ongoing Ukraine war will also be a contributor to this sentiment.
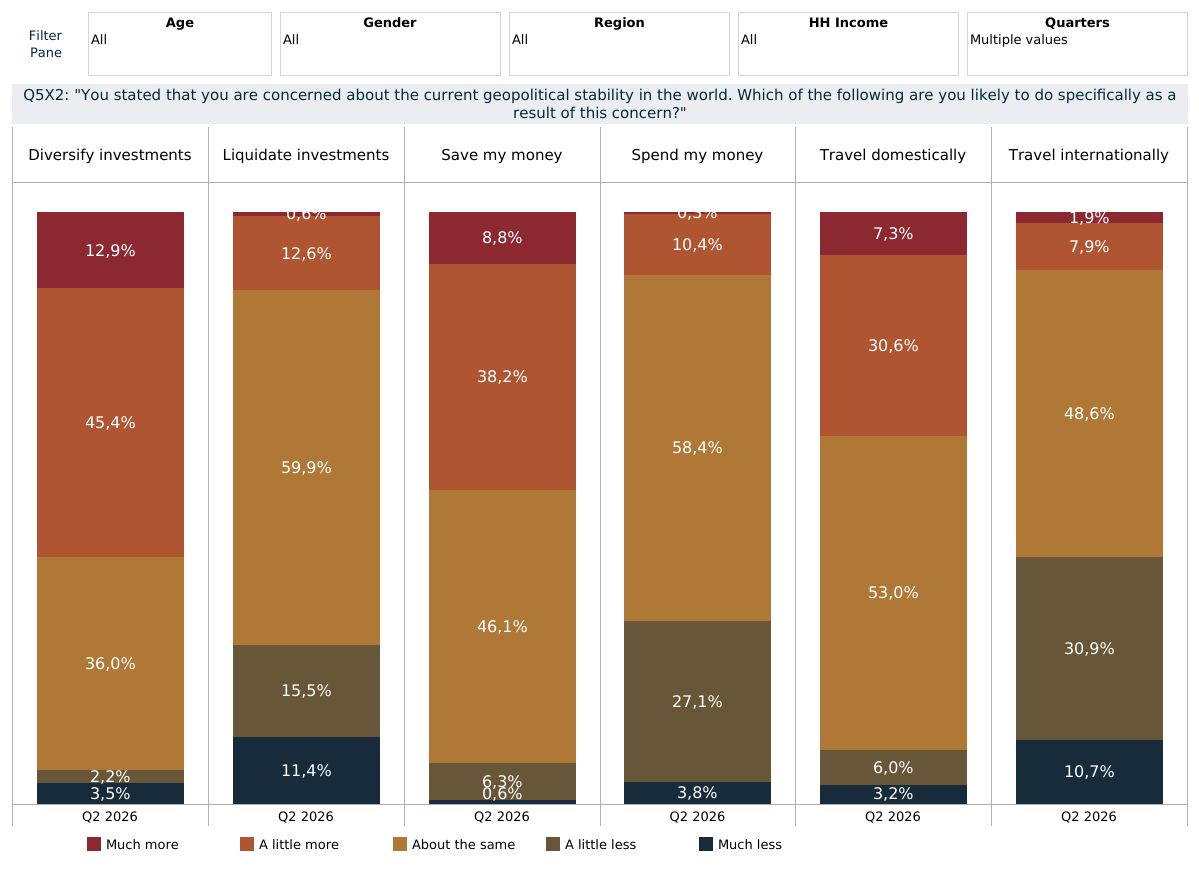
“You stated that you are concerned about the current geopolitical stability in the world. Which of the following are you likely to do specifically as a result of this concern?”
Base: 317 global affluent/HNWIs who stated concern about the current geopolitical stability | Source: LuxuryOpinions®/AltiantAs a result of the rising geopolitical concern, we introduced a new question in Q2 2026 to understand how this is impacting behaviours. The question was asked to the 69% of respondents in Q2 who were concerned about the instability. In terms of spending, 58% of respondents plan to spend about the same amount of money, while 31% think they will cut back (and only 11% expect to increase). In turn, 47% think they will save more vs only 7% for less.
In terms of travel, almost half (49%) plan to take about the same number of international trips. However, 42% think they will take fewer of these vs only 10% taking more. Instead, 38% plan to take more domestic trips and 53% about the same number of them (only 9% cutting back). Finally looking at finances, 58% plan to diversify their investmentsmore (vs only 6% consolidating), while only 13% plan to liquidate investments, with most (60%) not planning to make any changes.
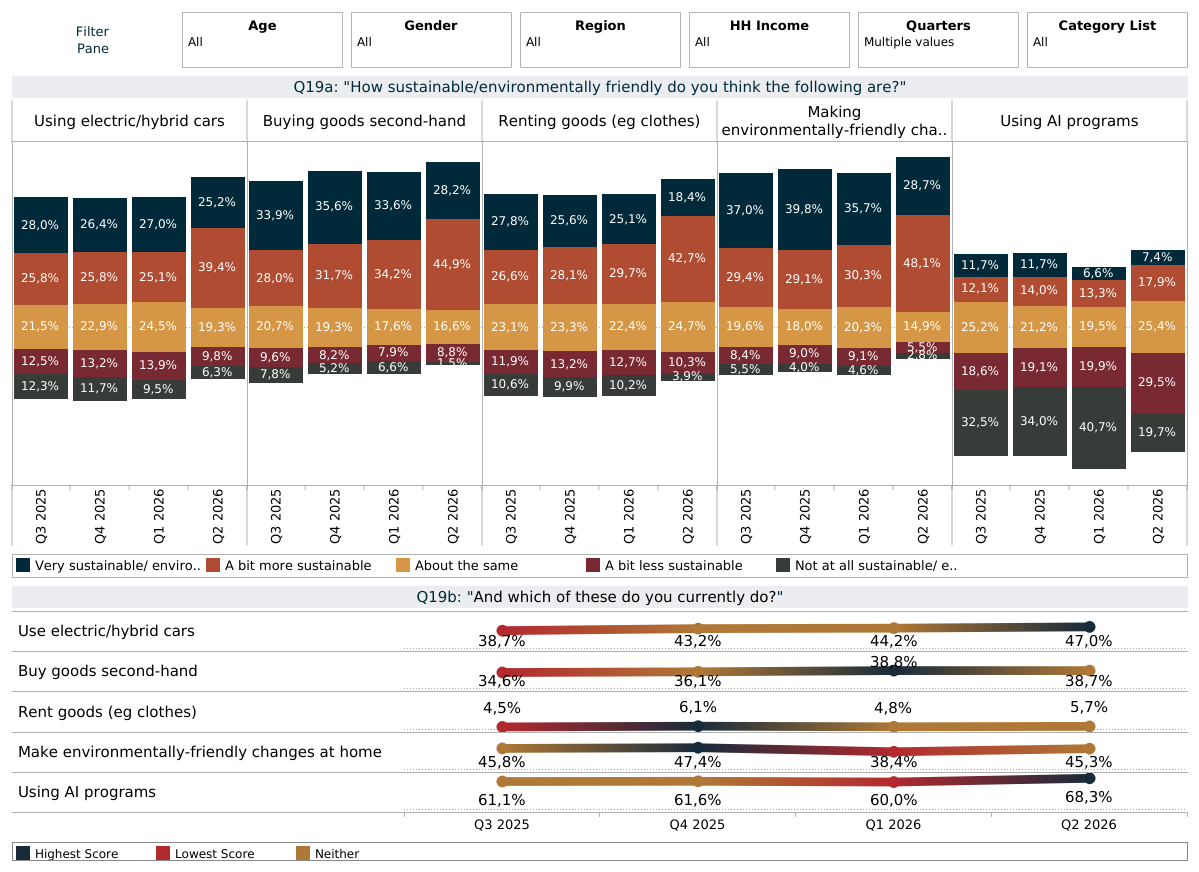
“How sustainable/environmentally friendly do you think the following are? / And which of these do you currently do?
Base: 9,047 global affluent/HNWIs | Source: LuxuryOpinions®/AltiantThe ongoing climate crisis means that many wealthy individuals are now scrutinising their own actions and how they are contributing to, or alleviating, this issue. Perceived green credentials can be highly influential, and the growth of the rental and second-hand market has been built around the circular economy.
While some studies have questioned the legitimacy of these claims, consumer perception is key. This appears to be broadly positive as three in five (61%) think that renting goods is either somewhat or very environmentally-friendly, rising to 73% for buying goods second-hand. Some 39% say that they are already doing the latter, though only 6% are currently renting.
Another significant behavioural change is the increasing need to find alternative fuels for driving. The growth of electric and hybrid cars has been broadly positive, albeit with some ongoing concerns about the convenience of charging and battery reliability (‘range anxiety’). Nevertheless, 25% think that these cars are very environmentally-friendly, with another 39% thinking they are somewhat so. Almost half (47%) have already made the switch to electric or hybrid cars, a new tracker high point, although some countries are reporting waning driver interest and a reversion back to ICE vehicles.
There are also growing energy demands coming fromthe use of AI programs. As of Q2 2026, only7%think that these are sustainable or environmentally friendly, with 49% believing they are not very/at all green. Over-40s and Europeans are the most likely to have a negative impression of AI’s sustainability credentials. Nevertheless,68%of the Q2 sample are already using such programs, rising to almost three quarters of millennials, American and APAC respondents.
Many wealthy individuals are also making sustainable changes at home, for example by investing in solar panels or heat pumps. Three quarters (77%) believe that these actions are very or somewhat environmentally friendly, with broadly high response across the demographics. Almost half (45%) of the Q2 sample have already taken some of these steps, only falling back in Asia (28%).
The Importance of Sustainability
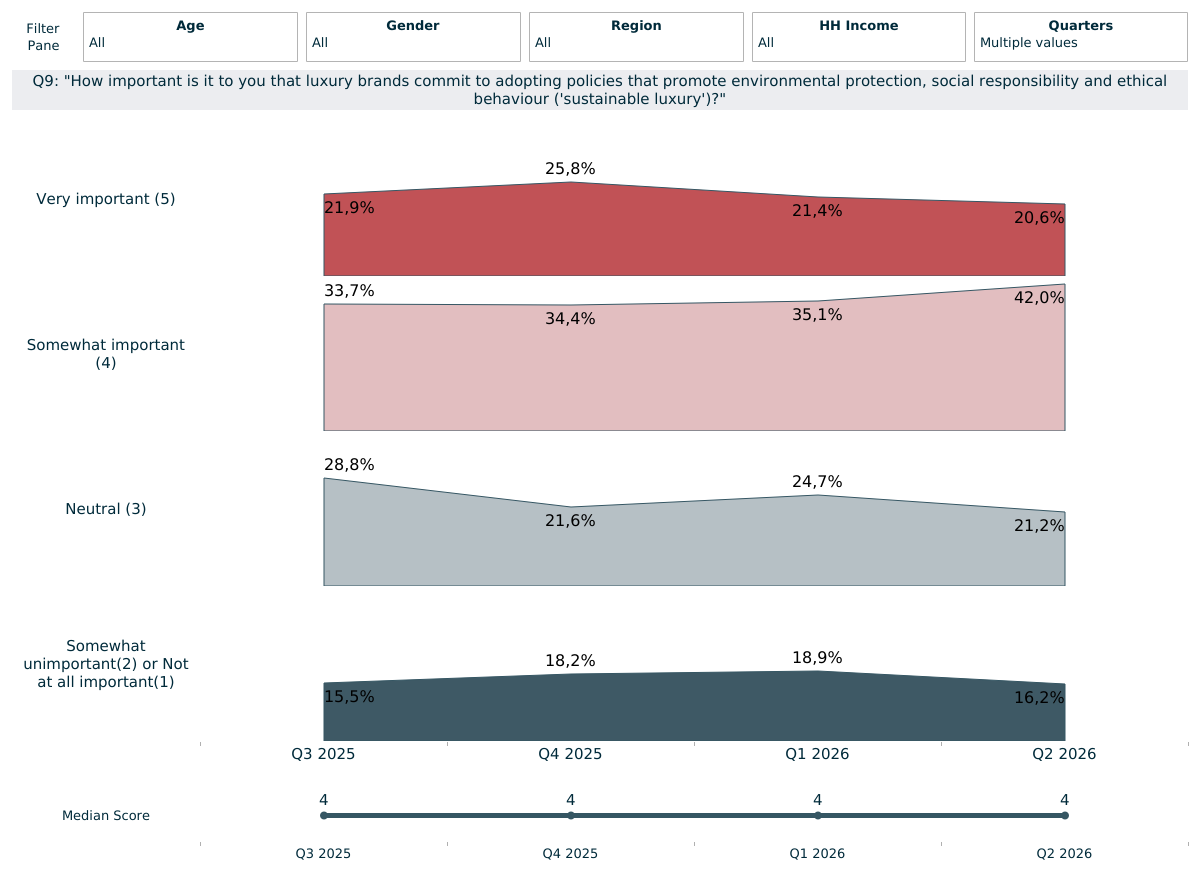
“How important is it to you that luxury brands commit to adopting policies that promote environmental protection, social responsibility and ethical behaviour (sustainable luxury)?”
Base: 9,047 global affluent/HNWIs | Source: LuxuryOpinions®/AltiantThe ongoing climate crisis remains one of the most pressing issues globally. This has led to many becoming increasingly demanding of brands to acknowledge and act alongside them in alleviating climate concerns. Individuals are also becoming more aware of ‘greenwashing’ and discerning about brands which make sustainable claims. Three in five (63%) say that it is very or somewhat important to them for brands to do this. Only 16% now say that it is not very, or not at all important for brands to focus on sustainability, showing the importance of this issue for consumers.
Trading up for Sustainability
“Would you be prepared to pay more for a product which positions itself as sustainable luxury?”
Base: 15,012 global affluent/HNWIs | Source: LuxuryOpinions®/AltiantDespite some muted responses to brands’ sustainability efforts, many affluent consumers are seemingly prepared to back up their views about environmental protection and sustainability with their money. Only 30% of the Q2 sample are entirely unprepared to spend any more for sustainable/ethical luxury products, while 47% are prepared to spend up to 10% more, which could represent a sweet spot for brands to justify a small price premium.
The remaining 23% are prepared to spend more than 10% extra for sustainable/ethical luxury products, with 3% even being prepared to spend more than 25% extra. Trading up for sustainable goods resonates with under-40s more than over-40s overall.
Sustainable Luxury Champions
“Are there any luxury brands in any industry which you think are good examples of sustainable luxury? If so, which companies?”
Base: 15,012 global affluent/HNWIs | Source: LuxuryOpinions®/AltiantOver the course of our tracker so far, a handful of luxury brands have consistently stood out to wealthy individuals as sustainable luxury operators. The likes of Tesla, Stella McCartney, Gucci and Hermès garner a high share of the response each quarter, with these brands also being among the most cited in Q2. Meanwhile, many wealthy individuals do not state any specific sustainable brands or, even worse, actively mistrust some green claims, something which brands continue to have to work on resolving.
FOCUS ON FINANCE
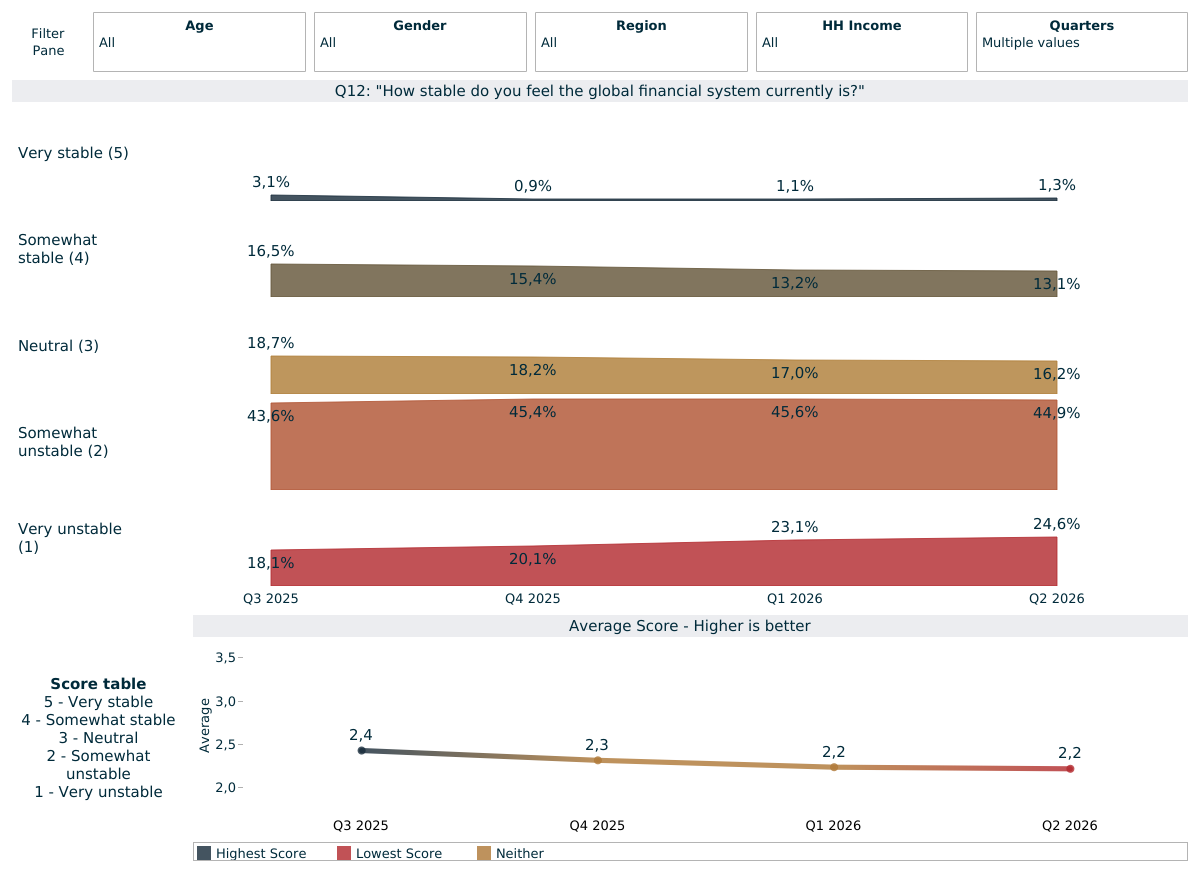
Global Financial System Stability
“How stable do you feel the global financial system currently is?”
Base: 15,012 global affluent/HNWIs | Source: LuxuryOpinions®/AltiantA variety of events have had a major impact upon global financial confidence in recent years. Perceived stability plummeted at the outset of the pandemic before recovering unevenly in the intervening years. In Q2 2025, it dropped to just 14%, before bobbing along at a slightly higher level for the remainder of the year. Concurrently, the share of those who thought that the system was very or somewhat unstable rose to 70% in Q2 and fell to a slightly lower level for the rest of 2025.
The US/Israel war with Iran is a key reason why perceived stability fell again in Q1 and Q2 2026 to just 14%, while the instability score exceeded two thirds (69% in Q2). The figures are broadly in line with the overall tracker highs/lows and will continue to set new records if the current conflicts persist. Only 16% now hold a neutral/uncertain position to this question.
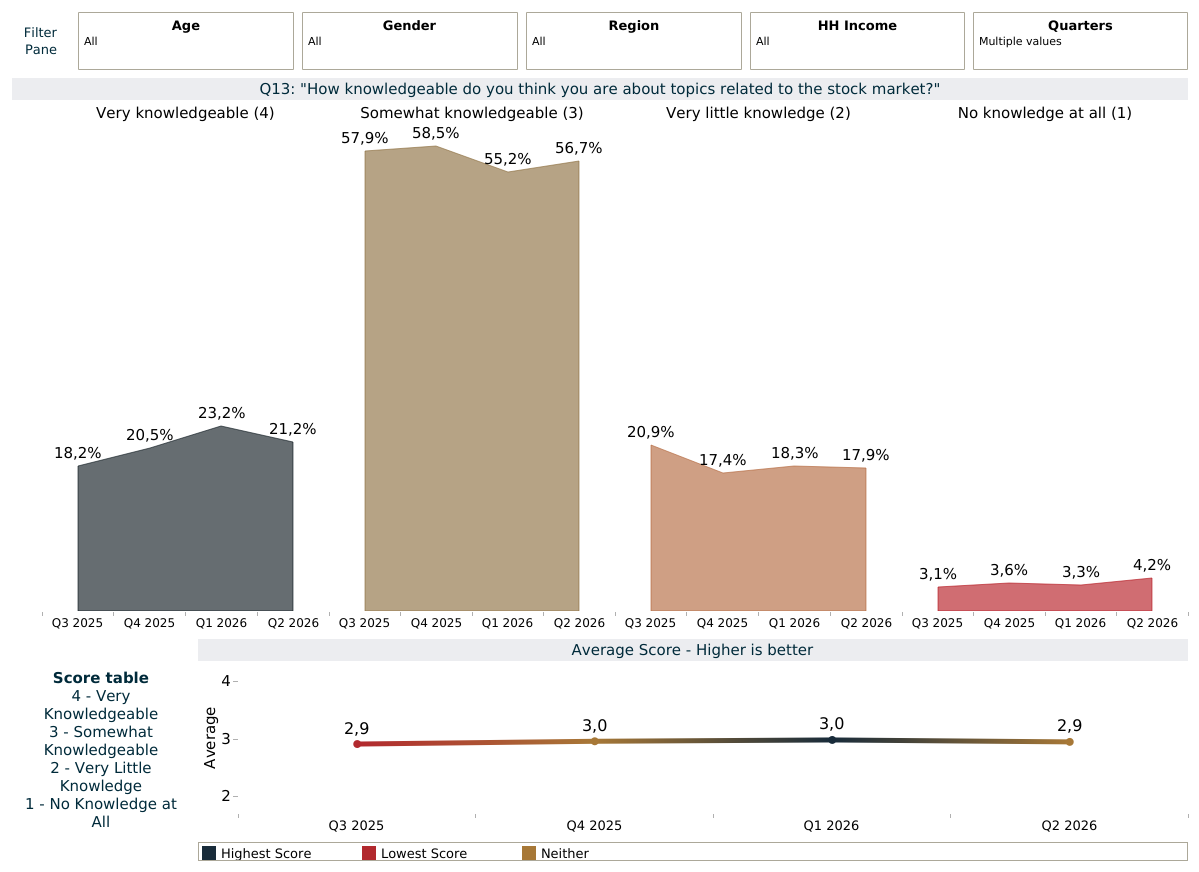
Stock Market Knowledge
“How knowledgeable do you think you are about topics related to the stock market?”
Base: 15,012 global affluent/HNWIs | Source: LuxuryOpinions®/AltiantSelf-claimed stock market knowledge has historically shown little quarterly variation, hovering around the 75-80% mark. This remained true in Q2 as 78% said that they are either very or somewhat knowledgeable, and with only 21% falling into the top box. Overall, 18% feel that they have very little stock market knowledge, while only 4% say they have none at all. Women remain much more likely to profess having little or no knowledge in this area (31% vs 16%).
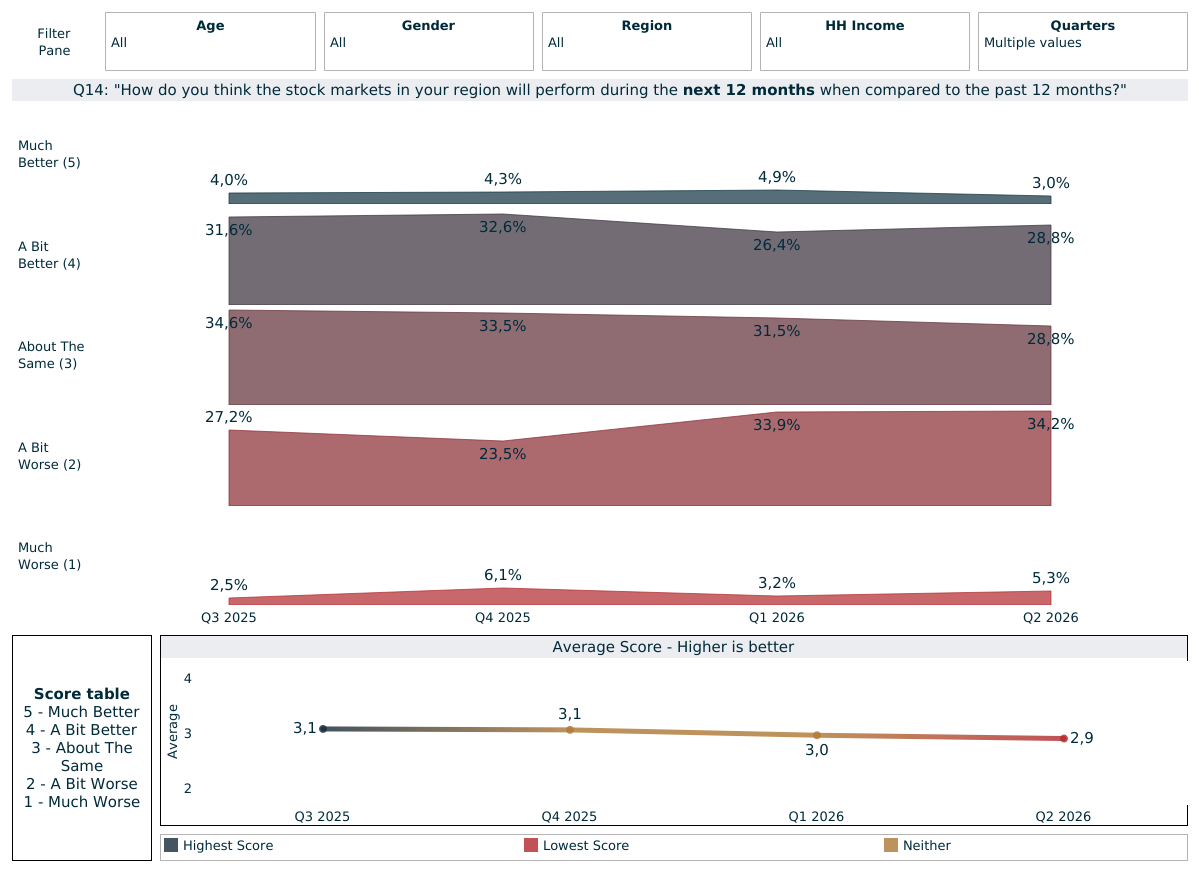
Regional Stock Market Confidence
“How do you think the stock markets in your region will perform during the next 12 months when compared to the past 12 months?”
Base: 15,012 global affluent/HNWIs | Source: LuxuryOpinions®/AltiantStock market confidence dropped as low as 30% in Q2 2022, before recovering in an uneven manner since. However, this again dropped dramatically to a new tracker low in Q2 2025 (-15 vs the previous quarter), with just 27% expecting an improved performance in the year ahead. While this recovered a little in Q4 (to 37%), it fell away again in 2026 and stands at just 32% this quarter.
American respondents are now the most bullish (41%), while only 22% of Europeans feel confident about the year ahead. Overall, one third (29%) think that their stock performance will remain about the same, while 39% anticipate are expectant of a downturn, a small 2-percentage point rise vs Q1.
INVESTMENT PLANS
“Within the next 90 days, do you expect to make significant changes to your investment portfolio?”
Base: 9,047 global affluent/HNWIs | Source: LuxuryOpinions®/AltiantThere has been relatively little movement on this question over the past three years, with only around one quarter planning to make significant imminent changes to their portfolios, while half did not. However, caution now appears to be the priority as just under two thirds (62%) do not anticipate making changes vs only who 19% do. One in five (19%) remain unsure. The ongoing market turbulence and uncertainty, largely emanating from the US, is likely to be a key reason for the shift in these results over the past year.
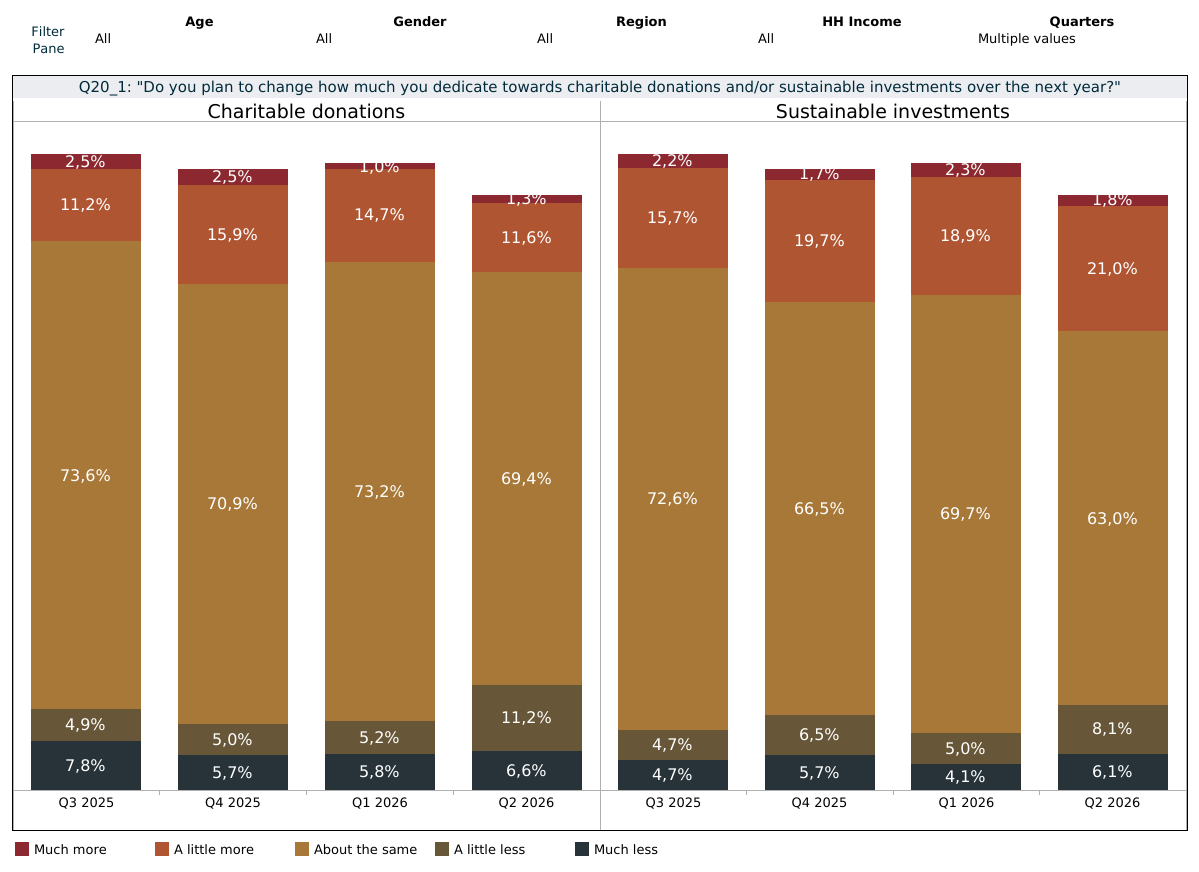
“Do you plan to change how much you dedicate towards charitable donations and/or sustainable investments over the next year?”
Base: 5,226 global affluent/HNWIs | Source: LuxuryOpinions®/AltiantOnly 13% say that they will be making more charitable donations in the year ahead. Two thirds (69%) expect to donate about the same amount as before, while 18% anticipate cutting back. A similar pattern emerges for planned sustainable investments, with 23% expecting to increase these, 63% planning to maintain and only 14% cutting back.
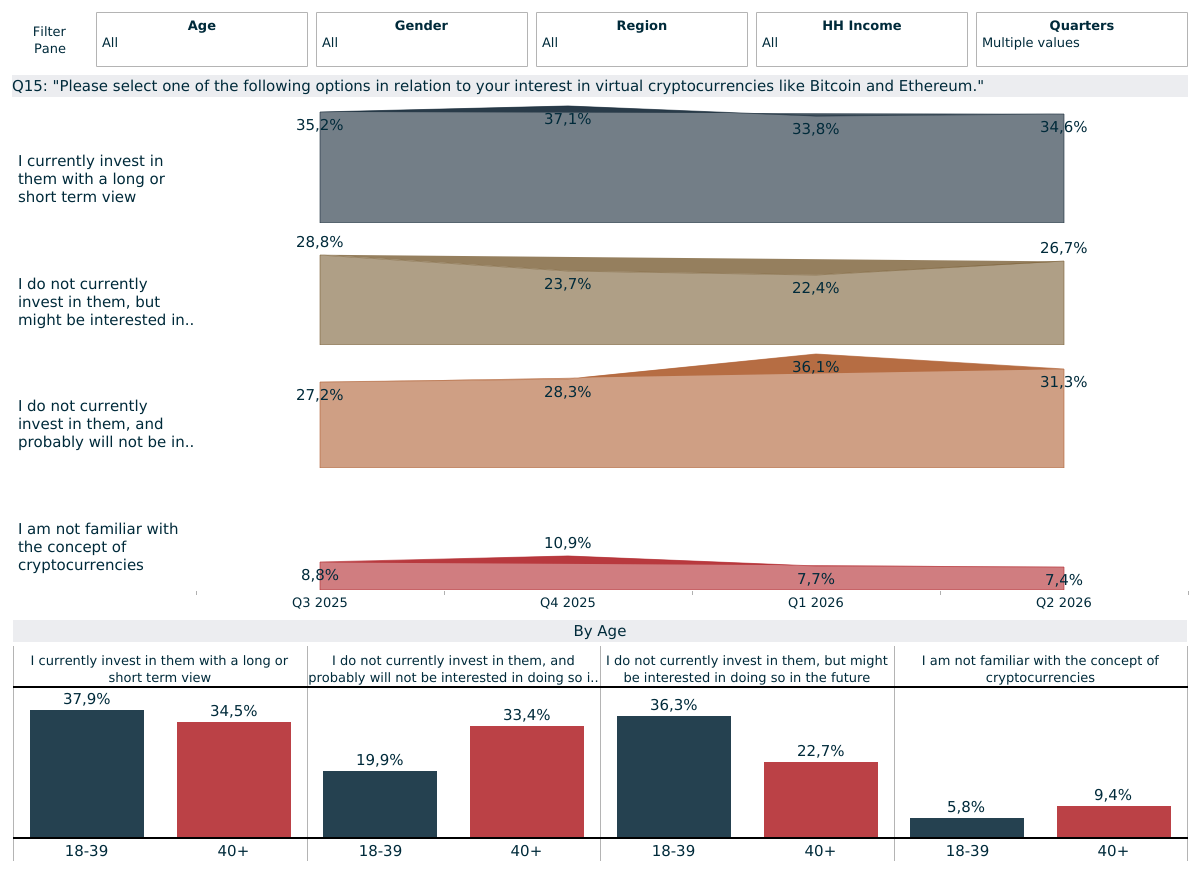
Investing in Cryptocurrencies
“Please select one of the following options in relation to your interest in virtual cryptocurrencies like Bitcoin and Ethereum.”
Base: 15,012 global affluent/HNWIs | Source: LuxuryOpinions®/AltiantCryptocurrency continues to attract a high level of media interest amid ongoing controversies. Only 7% of the global affluent are now entirely unfamiliar with them. Following a significant drop in 2022, Bitcoin values reached a new all-time high of $124,000 in August 2025 before falling away thereafter and ending the full year around 6% down.
The decline gathered pace in the first half of 2026, falling to around $62,000, a -30% decline YTD, at the time of writing. In such times of uncertainty, safer assets such as gold and S&P stocks are likely to find greater favour among affluent/HNWIs, as was also seen in our recently published Wealth Management report.
As of Q2 2026, 25% of global affluent/HNWIs were long-term crypto investors, driven by Americans and men, while 10% invested with a short-term view. Bitcoin remains the most popular digital currency by some distance. While some investors only do so for single coins – typically Bitcoin – many also dabble in others such as Ethereum.
The continued unpredictability and volatility of crypto appears to have hardened the opposition: the share of current non-investors but who might be interested in doing so fell back steadily in 2023 and remained at around a quarter since (27% in Q2). Finally, 31% now say that they do not currently invest in crypto and do not think they will do so in the future.
FOCUS ON TRAVEL AND LEISURE TIME
Holiday habits and intention
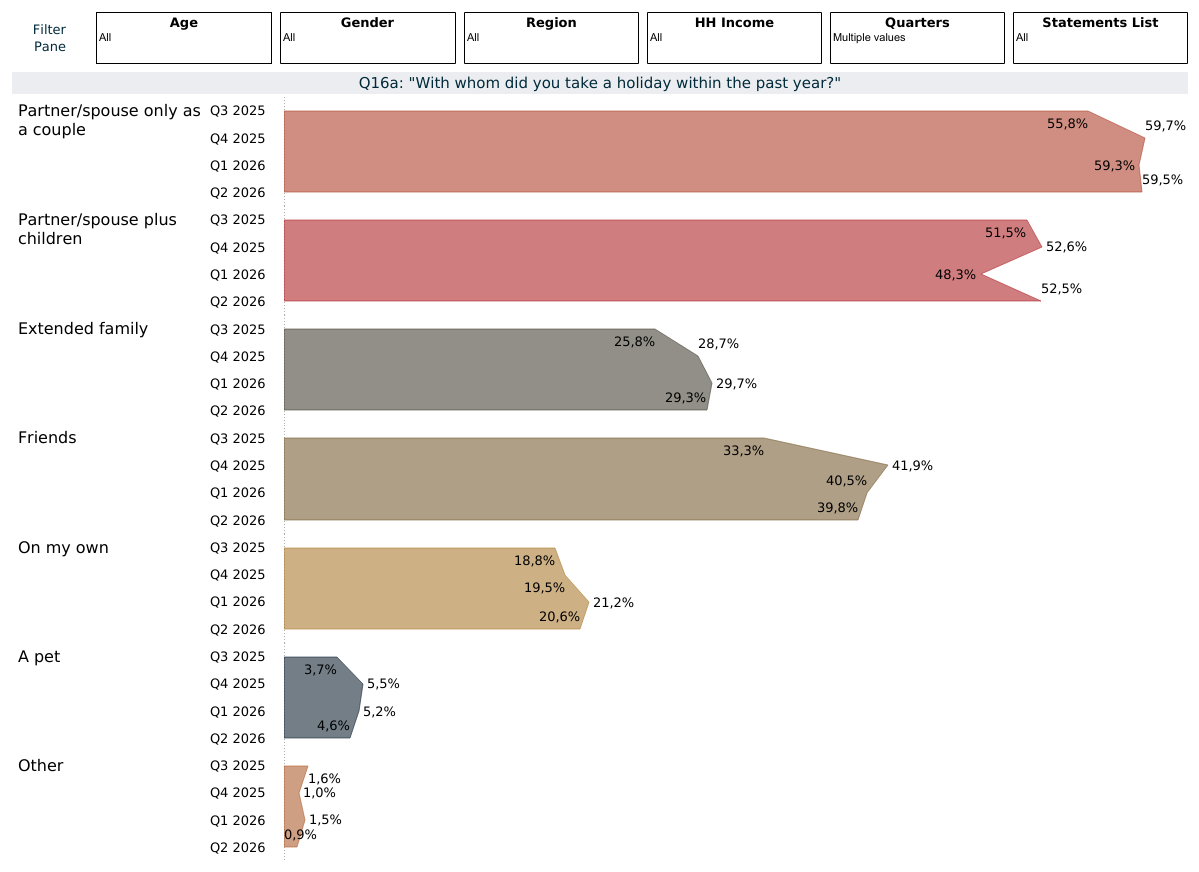
“With whom did you take holiday within the past year?
Base: 2,830 global affluent/HNWIs | Source: LuxuryOpinions®/AltiantAs per the results from this quarter, couple trips remain the most popular overall (60%), closely followed by couples plus children (53%). Holidays with friends were also surprisingly commonplace at 40%, rising to 55% among under-40s. Multi-generational/extended family trips (29%) and solo travel (21%) also provide the tourism industry with significant opportunities to tap into.
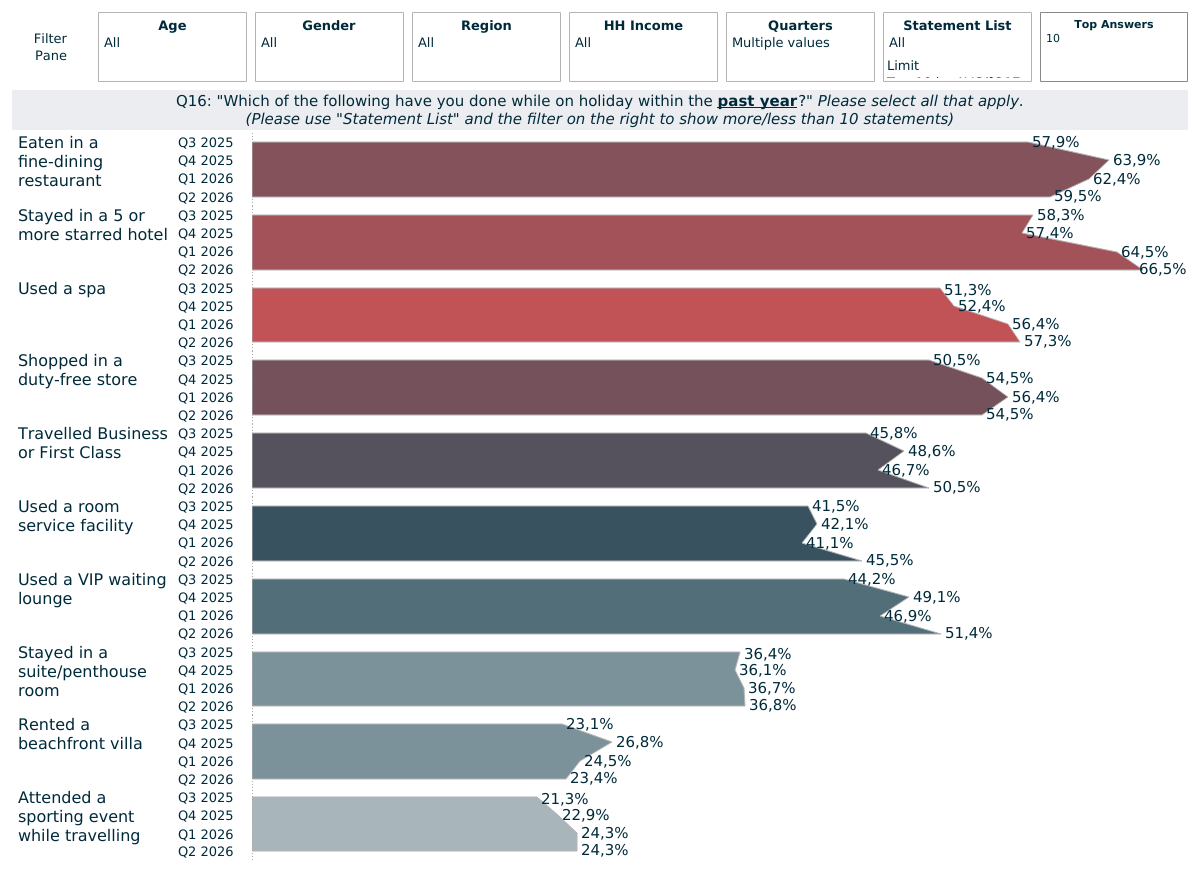
“Which of the following have you done while on holiday within the past year?”
[Note: in Q4 2021 this question was from a three-year time period to one-year]
Base: 15,012 global affluent/HNWIs | Source: LuxuryOpinions®/AltiantLuxury is important right from the start of respondents’ holidays, including at the airport: around half shopped in a duty-free store (55%), used a VIP waiting lounge and travelled by business/first-class within the past year (both 51%).Alcohol, perfume and cosmetic purchases were commonplace among those who shopped in a duty-free store. 5* or more hotels remain highly popular, used by 67%, while 37% stayed in a suite/penthouse room and 23% rented a beachfront villa. Fine dining (60%) and room services/concierges (46%) also continue to attract many of these travellers.
Spas were used by more than half (57%) within the past 12 months, with under-40s remaining the most likely users (63%). Wellness tourism continues to flourish as more luxury hotels acknowledge the appeal of slowing down and relaxation; indeed, 26% say that they had been to a wellness retreat over the past year.
Many wealthy individuals are also extending business trips for a holiday (workations). Almost one quarter (21%) say that they have done this over the past year, while a similar share had a private transport experience such as a helicopter ride (21%), attended a sporting event (24%) or used a private chauffeur (26%). Americans are the most likely to have treated themselves on their luxury holidays in most of these listed activities, with very little overall change vs Q1.
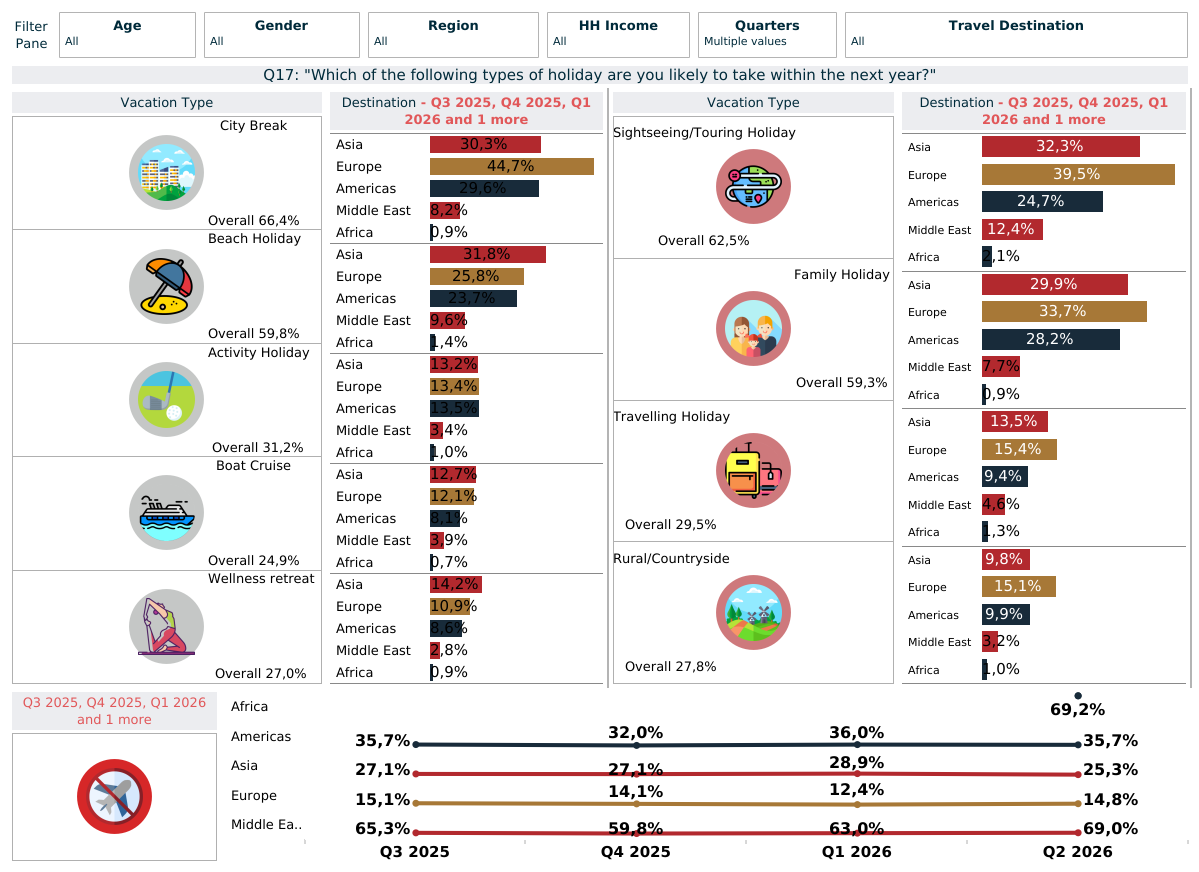
“Which of the following types of holiday are you likely to take within the next year?”
Base: 15,012 global affluent/HNWIs | Source: LuxuryOpinions®/AltiantWhile many individuals continue to favour domestic trips, or going to countries closer to home, international holidays had firmly recovered from the post-Covid dip (see Sections 1 and 2). However, the US/Israel war with Iran has had a significant impact on the perceived safety of travelling to the Middle East, something which is likely to persist in the coming months. As of the Q2 results, only 22% of the total sample said that they expected to travel to the region in the year ahead.
Different holiday types see wide variance in popularity across the regions, with many wealthy travellers now looking for hidden gems and lesser-known destinations off the beaten track. Overall, city breaks are set to be the most popular type in 2026/27 (67%), closely followed by sightseeing or tourist breaks (66%), beach holidays (64%) and family trips (63%).
Multi-generational trips remain popular, along with rural/countryside holidays such as glamping (28%), reflecting many travellers’ ongoing desire for privacy. Wellness retreats are also likely to retain their popularity as the wealthy look to improve their physical and mental health: 32% plan to visit one of these in the year ahead.
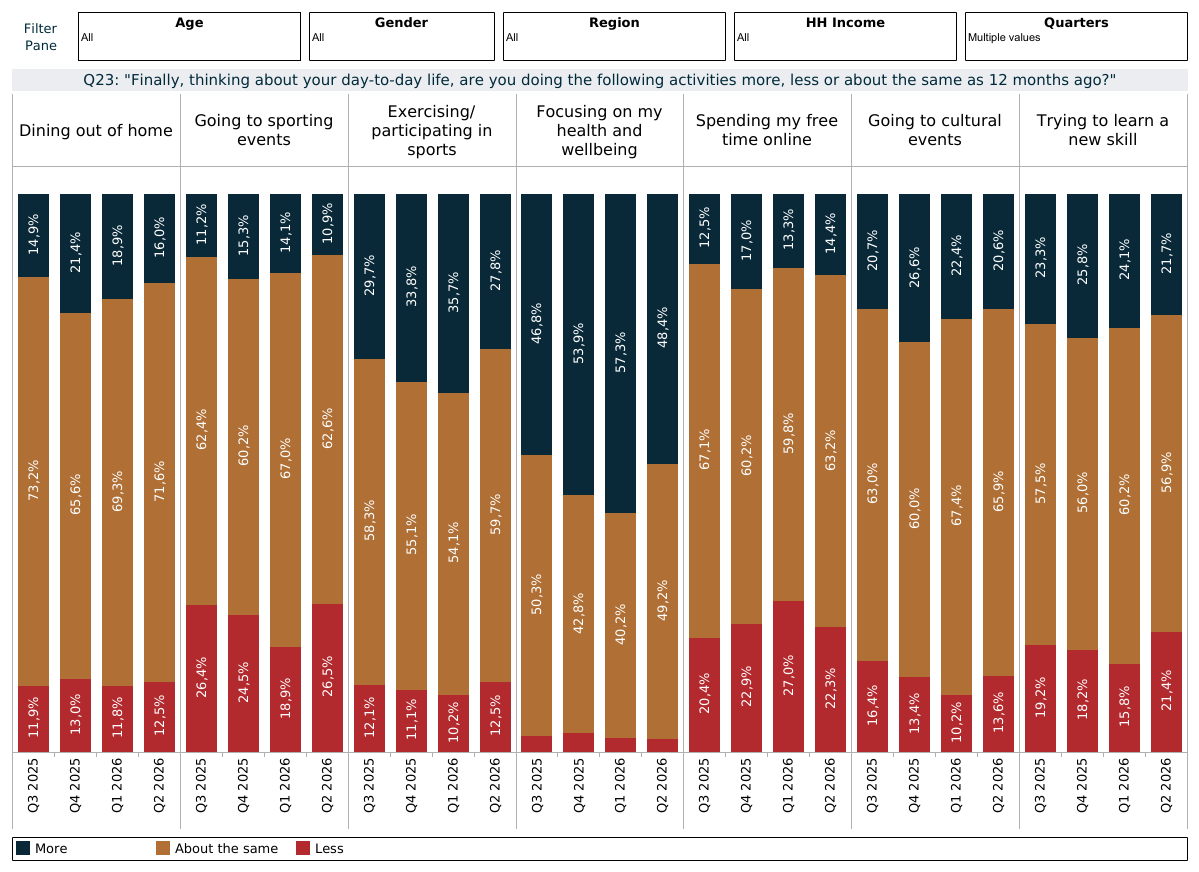
“Thinking about your day-to-day life, are you doing the following activities more, less or about the same as 12 months ago?
Base: 15,012 global affluent/HNWIs | Source: LuxuryOpinions®/AltiantThis last question was introduced at the start of 2025 to provide a better overview of respondents’ leisure time when they are not on holiday. There are continuing signs of a move to in-person experiences and reduction of screen time. While 63% say that they are spending about the same amount of time online, 22% have reduced this vs 14% who are doing so more often. Europeans are the most likely to be cutting back on their screen time (29%), vs only 17% in APAC.
Health is becoming an increasingly key component in their lives, with 49% focusing on their health and wellbeing about as much as last year, while 48% are giving it greater importance. Specifically to sports and exercise participation, 60% are maintaining their levels of activity, while 28% are doing so more often. Finally, rising costs continue to not be a significant deterrence for dining out of home, going to sporting and cultural events. Around two thirds are doing so about the same as a year ago, with one in five doing so more often.
Publications contained in the Altiant Knowledge Center are free to use, we simply require proper attribution. In no event shall Altiant be liable for any indirect, special or consequential damages in connection with any use of the provided data. Altiant does prohibit the selling of any information contained within or derived from these reports and monitors.